empty
31.10.2022 11:20 AM
Technical analysis of BITCOIN on October 31, 2022

This image is no longer relevant

BITCOIN

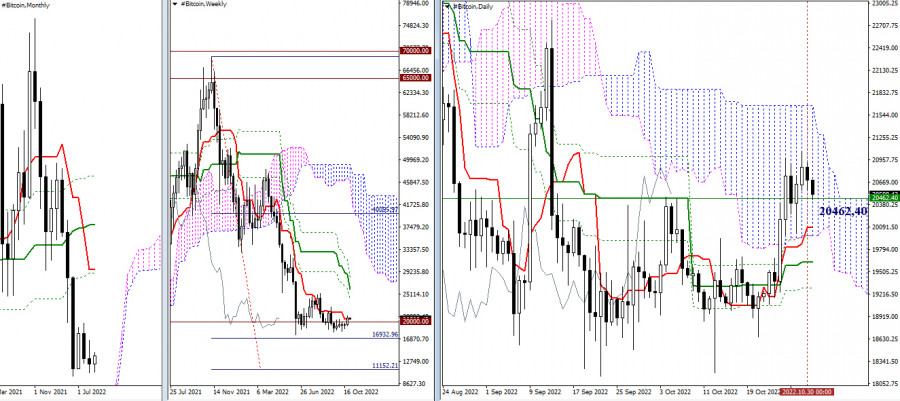
Following a bull run to 65,000, BTC failed to reach 70,000 and went deep down. Amid the increased bearish activity, a reversal took place. Ichimoku crosses saw changes in the weekly and monthly time frames. In addition, the weekly Cloud was broken and a bearish target formed. The targets at 16933 and 11152 are now seen as important barriers for the downtrend to extend. However, bitcoin is currently consolidating around the psychological support level of 20,000. Should the bears push the price further down, the bulls consolidate above the weekly short-term trend (20,462.40) and BTC leave the daily Cloud and enter a bullish zone, the target would stand at 24,043.77. The price would hit the target in case of a breakout through the daily Ichimoku Cloud and the resistance of the weekly Cross.

This image is no longer relevant

H4-H1

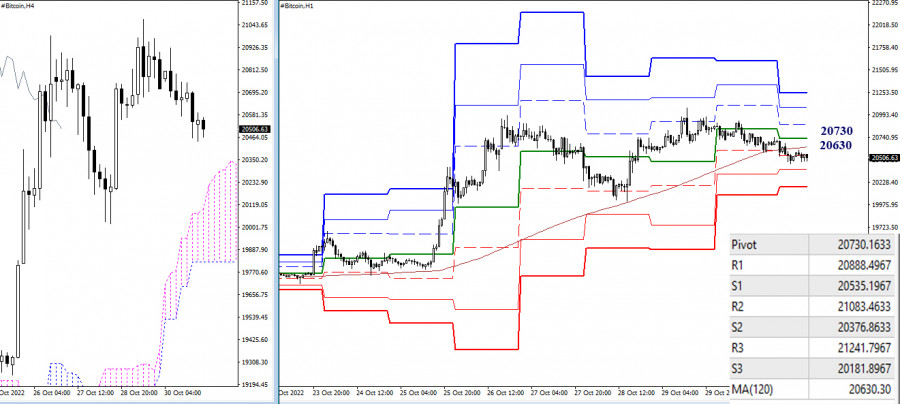
In the lower time frames, the downtrend is getting deeper. The bears are now active below the key levels of 20,630 – 20,730 (weekly long-term trend + central Pivot level). The downtrend would extend should bearish sentiment increase. The nearest intraday support levels are seen at 20,376.86 and 20,181.90 (classic Pivot levels). If BTC returns to the key levels of the lower time frames (20,630 – 20,730), the targets will stand at 20,888.50 – 21,083.46 – 21,241.80, in line with classic Pivot resistance.

***

Indicators used in technical analysis:

Higher time frames – Ichimoku Kinko Hyo (9.26.52) + Fibo Kijun

H1 – Pivot Points (classic) + Moving Average (120) (weekly long-term trend)

Evangelos Poulakis,
الخبير التحليلي لدى شركة إنستافوركس
© 2007-2025
حدد الإطار الزمني
5
د
15
د
30
د
1
س
4
ساعات
1
يوم
1
أسبوع
كسب عائد من تغيرات أسعار العملات المشفرة مع إنستافوركس.
قم بتحميل منصة التداول ميتاتريدر 4 وافتح أول صفقة.
  • Grand Choice
    Contest by
    InstaForex
    InstaForex always strives to help you
    fulfill your biggest dreams.
    انضم إلى المسابقة

المقالات الموصى بها

الدولار الأمريكي/الين الياباني. التحليل والتوقعات. الوضع الحالي للسوق

من الناحية الفنية، بما أن المشترين قد تجاوزوا حاجز المتوسط المتحرك البسيط لـ 100 يوم حول مستوى 146.80، فإنهم يظلون مسيطرين. الشراء فوق المستوى النفسي 147.00 يؤكد النظرة الإيجابية،

Irina Yanina 17:53 2025-06-23 UTC+2

إشارات التداول لليورو/الدولار الأمريكي للفترة من 23 إلى 28 يونيو 2025: الشراء فوق 1.1460 (21 SMA - 6/8 Murray)

على العكس، تعتبر هذه المنطقة حول المتوسط المتحرك البسيط لـ 21 يومًا، الموجود عند المستوى النفسي 1.15، منطقة رئيسية. أسفل هذه المنطقة، يمكننا أن نتوقع حدوث كسر حاد في قناة

Dimitrios Zappas 16:34 2025-06-23 UTC+2

إشارات التداول للذهب (XAU/USD) للفترة من 23 إلى 28 يونيو 2025: الشراء فوق 3,350 دولار (21 SMA - 7/8 Murray)

إذا استمر الذهب في التعافي واستقر فوق المتوسط المتحرك البسيط لـ 21 يومًا عند 3,364، فقد يُعتبر ذلك فرصة للشراء مع أهداف عند 8/8 موراي عند 3,437. قد يصل المعدن

Dimitrios Zappas 16:23 2025-06-23 UTC+2

توقعات الفوركس 23/06/2025: اليورو/الدولار الأمريكي، الجنيه الإسترليني/الدولار الأمريكي، مؤشر الدولار الأمريكي، النفط، الإيثيريوم والبيتكوين

روابط مفيدة: مقالاتي الأخرى متوفرة في هذا القسم دورة InstaForex للمبتدئين التحليلات الشائعة افتح حساب تداول مهم: يجب على المبتدئين في تداول الفوركس أن يكونوا حذرين للغاية عند اتخاذ القرارات

Sebastian Seliga 12:08 2025-06-23 UTC+2

التحليل الفني للأسبوع من 23 إلى 28 يونيو: زوج العملات GBP/USD

في الأسبوع الماضي، تحرك الزوج نحو الأسفل واختبر مستوى التراجع بنسبة 14.6% عند 1.3392 (الخط الأحمر المتقطع)، وبعد ذلك ارتد السعر وأغلق الشمعة الأسبوعية عند 1.3446. في الأسبوع القادم،

Stefan Doll 11:38 2025-06-23 UTC+2

التحليل الفني للأسبوع من 23 إلى 28 يونيو: زوج العملات EUR/USD

في الأسبوع الماضي، تحرك الزوج نحو الأسفل واختبر مستوى التراجع بنسبة 76.4% عند 1.1452 (الخط الأحمر المتقطع)، وبعد ذلك ارتد السعر وأغلق الشمعة الأسبوعية عند 1.1520. في الأسبوع القادم،

Stefan Doll 11:31 2025-06-23 UTC+2

التوقعات لليورو/الدولار الأمريكي في 23 يونيو 2025

يوم الجمعة، واصل زوج اليورو/الدولار الأمريكي الارتفاع بعد الارتداد من مستوى التصحيح 76.4% عند 1.1454. ومع ذلك، في ليلة الاثنين، عاد الزوج إلى هذا المستوى. يسمح الارتداد الجديد بتوقعات

Samir Klishi 11:24 2025-06-23 UTC+2

التوقعات لزوج الجنيه الإسترليني/الدولار الأمريكي في 23 يونيو 2025

على الرسم البياني الساعي، استقر زوج الجنيه الإسترليني/الدولار الأمريكي يوم الجمعة تحت منطقة الدعم 1.3425–1.3444، مما يسمح مرة أخرى بتوقع استمرار الانخفاض نحو مستوى الدعم 1.3357–1.3373. الارتداد من هذه المنطقة

Samir Klishi 11:19 2025-06-23 UTC+2

التحليل الفني لحركة السعر اليومية لأزواج العملات الغريبة USD/IDR، الاثنين 23 يونيو 2025.

16473.27 حاليًا على الرسم البياني اليومي، يظهر زوج العملات الغريب USD/IDR نمط صعودي 123 مما يشير إلى أن USD/IDR يشهد حاليًا تعزيزًا، حيث يتم تأكيد ذلك أيضًا من خلال حركة

Arief Makmur 07:29 2025-06-23 UTC+2

التحليل الفني لحركة السعر اللحظية لأداة سلعة النفط الخام، الاثنين 23 يونيو 2025.

بالإضافة إلى ظهور تباعد بين حركة سعر النفط الخام ومؤشر المذبذب العشوائي على الرسم البياني لمدة 4 ساعات، هناك أيضًا نمط هبوطي 123 ونمط مثلث حيث تشير كل هذه الحقائق

Arief Makmur 07:29 2025-06-23 UTC+2
لا تستطيع التحدث الآن؟
اطرح سؤالك في الدردشة.
Widget callback
 

Dear visitor,

Your IP address shows that you are currently located in the USA. If you are a resident of the United States, you are prohibited from using the services of InstaFintech Group including online trading, online transfers, deposit/withdrawal of funds, etc.

If you think you are seeing this message by mistake and your location is not the US, kindly proceed to the website. Otherwise, you must leave the website in order to comply with government restrictions.

Why does your IP address show your location as the USA?

  • - you are using a VPN provided by a hosting company based in the United States;
  • - your IP does not have proper WHOIS records;
  • - an error occurred in the WHOIS geolocation database.

Please confirm whether you are a US resident or not by clicking the relevant button below. If you choose the wrong option, being a US resident, you will not be able to open an account with InstaForex anyway.

We are sorry for any inconvenience caused by this message.