empty
20.04.2023 12:11 PM
EUR/USD and GBP/USD trading plan for beginners on April 20, 2023

Details of the economic calendar on April 19

UK inflation data disappointed investors. The growth rate of consumer prices slowed down from 10.4% to 10.1%, which is worse than the forecast of 9.8%. This data may push the Bank of England to continue the cycle of tightening monetary policy.

In Europe, the final inflation data matched the preliminary estimate, which indicated a slowdown in the pace of growth from 8.5% to 6.9%. Since the data was already priced in, there was no reaction in the market at the time of publication.

Analysis of trading charts from April 19

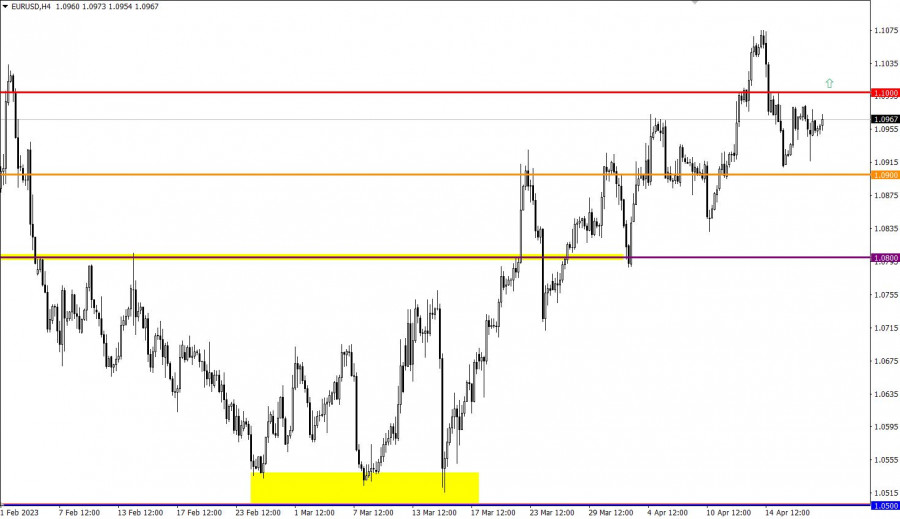
Despite the recent attempt to restore the EUR/USD exchange rate relative to the recent decline, the quote is still below the 1.1000 level. This movement indicates a slowdown in the upward trend but not its completion.

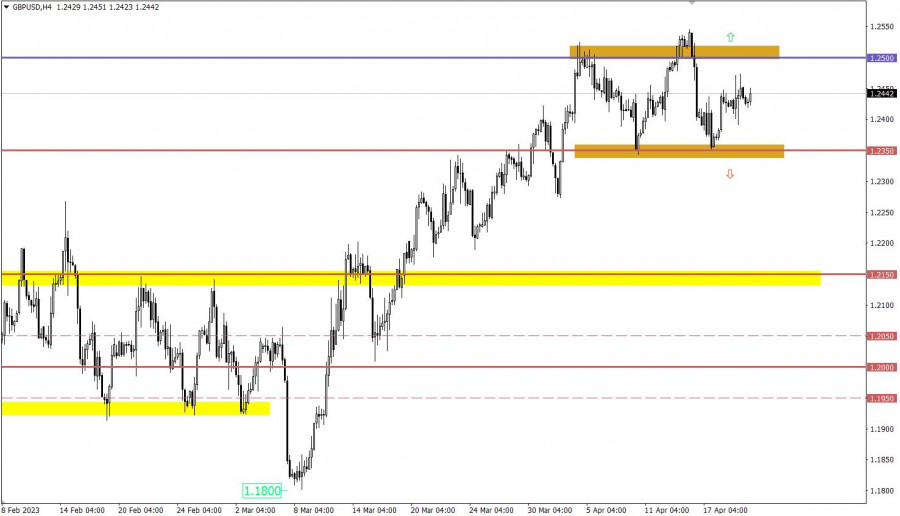
GBP/USD is in the stage of short-term stagnation, which is within the framework of a two-week sideways amplitude of 1.2350/1.2550.

This image is no longer relevant

Economic calendar for April 20

During the American trading session, applications for unemployment benefits in the United States will be published, where an increase in their overall indicator is forecasted. Details of statistical data indicate that the volume of continuing claims for benefits may rise from 1.810 million to 1.820 million, and the volume of initial claims for benefits may rise from 239,000 to 240,000.

The increase in the number of applications for benefits is a negative factor for the labor market.

Time targeting:

U.S. Jobless Claims – 12:30 UTC

EUR/USD trading plan for April 20

In the current situation, traders continue to consider two possible scenarios in their work: the first, a possible price rebound from the 1.1000 level with the intensification of the corrective movement, and the second, holding the price above the 1.1000 level with the possibility of updating the local high in the medium-term trend.

This image is no longer relevant

GBP/USD trading plan for April 20

The stagnation at the 1.2430 level will soon end in this situation. From a technical analysis perspective, the current pause can be defined as a process of accumulating trading forces, which can lead to the emergence of an outgoing impulse. However, the main range of price changes is within 1.2350/1.2550. Therefore, the end of the short-term stagnation may lead to quotes approaching one of the main range borders, depending on the direction of the outgoing impulse.

This image is no longer relevant

What's on the charts

The candlestick chart type is white and black graphic rectangles with lines above and below. With a detailed analysis of each individual candle, you can see its characteristics relative to a particular time frame: opening price, closing price, intraday high and low.

Horizontal levels are price coordinates, relative to which a price may stop or reverse its trajectory. In the market, these levels are called support and resistance.

Circles and rectangles are highlighted examples where the price reversed in history. This color highlighting indicates horizontal lines that may put pressure on the asset's price in the future.

The up/down arrows are landmarks of the possible price direction in the future.

Gven Podolsky,
الخبير التحليلي لدى شركة إنستافوركس
© 2007-2025
حدد الإطار الزمني
5
د
15
د
30
د
1
س
4
ساعات
1
يوم
1
أسبوع
كسب عائد من تغيرات أسعار العملات المشفرة مع إنستافوركس.
قم بتحميل منصة التداول ميتاتريدر 4 وافتح أول صفقة.
  • Grand Choice
    Contest by
    InstaForex
    InstaForex always strives to help you
    fulfill your biggest dreams.
    انضم إلى المسابقة

المقالات الموصى بها

GBP/USD: خطة التداول للجلسة الأمريكية في 6 يونيو (مراجعة تداولات الصباح)

في توقعاتي الصباحية، قمت بتسليط الضوء على مستوى 1.3544 وخططت لاتخاذ قرارات دخول السوق بناءً عليه. دعونا نلقي نظرة على الرسم البياني لمدة 5 دقائق ونرى ما حدث. حدث انخفاض

Miroslaw Bawulski 15:38 2025-06-06 UTC+2

EUR/USD: خطة التداول للجلسة الأمريكية في 6 يونيو (مراجعة التداولات الصباحية)

في توقعاتي الصباحية، قمت بتسليط الضوء على مستوى 1.1407 وخططت لاتخاذ قرارات دخول السوق بناءً عليه. دعونا نلقي نظرة على الرسم البياني لمدة 5 دقائق ونرى ما حدث. كان هناك

Miroslaw Bawulski 15:36 2025-06-06 UTC+2

كيف تتداول زوج العملات GBP/USD في السادس من يونيو؟ نصائح بسيطة وتحليل التداول للمبتدئين

تحليل تداول يوم الخميس: الرسم البياني لزوج الجنيه الإسترليني/الدولار الأمريكي على إطار الساعة. واصل زوج الجنيه الإسترليني/الدولار الأمريكي حركته الصعودية يوم الخميس، على الرغم من وجود أسباب أقل لذلك مقارنة

Paolo Greco 09:57 2025-06-06 UTC+2

كيف تتداول زوج العملات EUR/USD في السادس من يونيو؟ نصائح بسيطة وتحليل التداول للمبتدئين

واصل زوج العملات EUR/USD حركته الصعودية يوم الخميس، متماشياً مع الاتجاه الحالي. لم تكن هناك أسباب لحدوث "ارتفاع" جديد للعملة الأوروبية. كان الحدث الرئيسي الوحيد يوم الخميس هو اجتماع البنك

Paolo Greco 09:51 2025-06-06 UTC+2

توصيات التداول وتحليل التداول لزوج الجنيه الإسترليني/الدولار الأمريكي في 6 يونيو 2025

واصل زوج العملات GBP/USD حركته الصعودية يوم الخميس، على الرغم من عدم وجود أسباب واضحة لذلك مرة أخرى. يستمر الجنيه الإسترليني في الارتفاع عمليًا في أي مناسبة

Paolo Greco 04:43 2025-06-06 UTC+2

توصيات التداول وتحليل التداول لزوج اليورو/الدولار الأمريكي في 6 يونيو 2025

واصل زوج العملات EUR/USD التداول بمكاسب يوم الخميس. حتى أحدث تخفيف للسياسة النقدية من قبل البنك المركزي الأوروبي لم يتمكن من إنقاذ الدولار. بالأمس، قرر المنظم الأوروبي للمرة الثامنة

Paolo Greco 04:26 2025-06-06 UTC+2

GBP/USD: خطة التداول للجلسة الأمريكية في 5 يونيو (مراجعة تداولات الصباح)

في توقعاتي الصباحية، ركزت على مستوى 1.3562 وخططت لاتخاذ قرارات دخول السوق حوله. دعونا نلقي نظرة على الرسم البياني لمدة 5 دقائق ونرى ما حدث. أدى النمو وتشكيل اختراق كاذب

Miroslaw Bawulski 19:46 2025-06-05 UTC+2

EUR/USD: خطة التداول للجلسة الأمريكية في 5 يونيو (مراجعة التداولات الصباحية)

في توقعاتي الصباحية، ركزت على مستوى 1.1407 وخططت لاتخاذ قرارات دخول السوق حوله. دعونا نلقي نظرة على الرسم البياني لمدة 5 دقائق ونحلل ما حدث. أدى الانخفاض وتشكيل اختراق كاذب

Miroslaw Bawulski 19:39 2025-06-05 UTC+2

كيفية تداول زوج الجنيه الإسترليني/الدولار الأمريكي في 5 يونيو؟ نصائح بسيطة وتحليل التداول للمبتدئين

واصل زوج الجنيه الإسترليني/الدولار الأمريكي حركته الصعودية يوم الأربعاء، متبعًا الاتجاه الجديد. تذكر أن السعر كان قد استقر تحت خط الاتجاه الصاعد السابق قبل أسبوع فقط، ومع ذلك لم يتشكل

Paolo Greco 06:39 2025-06-05 UTC+2

كيفية تداول زوج اليورو/الدولار الأمريكي في 5 يونيو؟ نصائح بسيطة وتحليل التداول للمبتدئين

في يوم الأربعاء، تداول زوج العملات اليورو/الدولار الأمريكي بتقلب منخفض وانحياز نحو الصعود. كنا نتوقع أن الخلفية الاقتصادية الكلية لن تؤثر بشكل كبير على تحركات الزوج، ولكن تبين أن جميع

Paolo Greco 06:39 2025-06-05 UTC+2
لا تستطيع التحدث الآن؟
اطرح سؤالك في الدردشة.
Widget callback
 

Dear visitor,

Your IP address shows that you are currently located in the USA. If you are a resident of the United States, you are prohibited from using the services of InstaFintech Group including online trading, online transfers, deposit/withdrawal of funds, etc.

If you think you are seeing this message by mistake and your location is not the US, kindly proceed to the website. Otherwise, you must leave the website in order to comply with government restrictions.

Why does your IP address show your location as the USA?

  • - you are using a VPN provided by a hosting company based in the United States;
  • - your IP does not have proper WHOIS records;
  • - an error occurred in the WHOIS geolocation database.

Please confirm whether you are a US resident or not by clicking the relevant button below. If you choose the wrong option, being a US resident, you will not be able to open an account with InstaForex anyway.

We are sorry for any inconvenience caused by this message.