empty
26.10.2023 05:08 AM
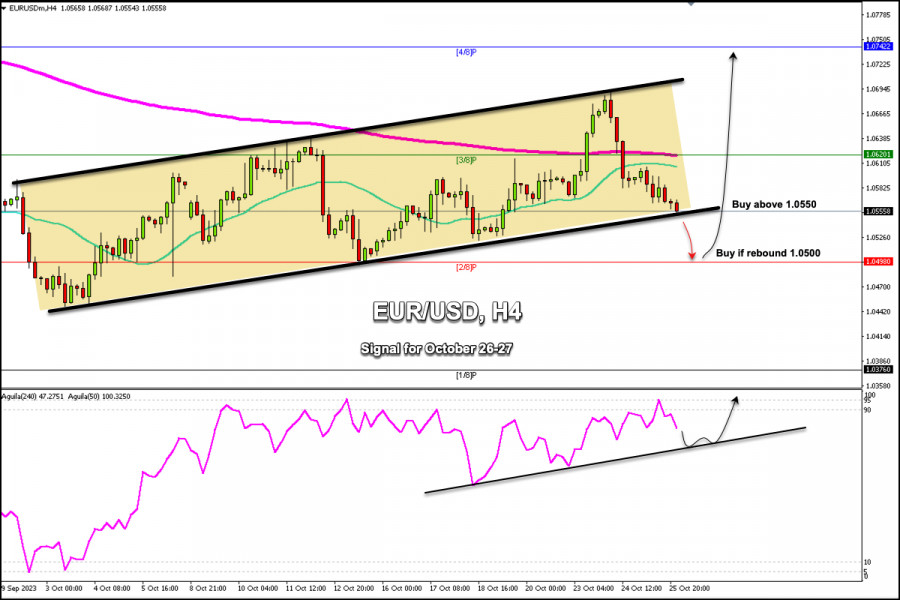
Trading Signals for EUR/USD for October 26-27, 2023: buy if rebounds at 1.0500 (2/8 Murray - rebound)

This image is no longer relevant

Early in the European session, the Euro (EUR/USD) is trading around 1.0555, below the 21 SMA, and below the 200 EMA. We can observe a strong technical correction after the Euro reached the level of 1.0694. If bearish pressure prevails, the euro could reach the psychological level of 1.05.

A sharp break of the uptrend channel formed since October 3, could push the euro towards the key zone of 2/8 Murray located at 1.0498. In case this scenario comes true, a strong technical rebound is expected around this area and the euro could resume its bullish cycle. The instrument could reach 3/8 Murray around 1.0622 up to 4/8 Murray 1.0742.

According to the H-4 chart, the euro is strongly overbought. So, a technical correction is likely to offer relief and be seen as an opportunity to resume buying.

In the next few hours, the decision on the monetary policy of the European Central Bank (ECB) will be published. Regarding the interest rate, it is expected that there will be no changes and it will remain at the current 5.5%. This data could offer strong volatility to the euro and it could rebound strongly, only if it falls towards the 1.05 area or consolidates above 1.0550.

On the other hand, in case the Euro fails to break the uptrend channel, it is expected to trade above the current price levels and we could expect it to rise and reach 1.0620 and 1.0742.

We can expect the euro to reach the resistance zone of 1.0620 only if it manages to stay above the daily pivot point (D_pivot) located at 1.0573. From this level, we could expect it to rise and reach the top of the uptrend channel around 1.0694.

Dimitrios Zappas,
الخبير التحليلي لدى شركة إنستافوركس
© 2007-2025
حدد الإطار الزمني
5
د
15
د
30
د
1
س
4
ساعات
1
يوم
1
أسبوع
كسب عائد من تغيرات أسعار العملات المشفرة مع إنستافوركس.
قم بتحميل منصة التداول ميتاتريدر 4 وافتح أول صفقة.
  • Grand Choice
    Contest by
    InstaForex
    InstaForex always strives to help you
    fulfill your biggest dreams.
    انضم إلى المسابقة

المقالات الموصى بها

توقعات الفوركس 23/06/2025: اليورو/الدولار الأمريكي، الجنيه الإسترليني/الدولار الأمريكي، مؤشر الدولار الأمريكي، النفط، الإيثيريوم والبيتكوين

روابط مفيدة: مقالاتي الأخرى متوفرة في هذا القسم دورة InstaForex للمبتدئين التحليلات الشائعة افتح حساب تداول مهم: يجب على المبتدئين في تداول الفوركس أن يكونوا حذرين للغاية عند اتخاذ القرارات

Sebastian Seliga 12:08 2025-06-23 UTC+2

التحليل الفني للأسبوع من 23 إلى 28 يونيو: زوج العملات GBP/USD

في الأسبوع الماضي، تحرك الزوج نحو الأسفل واختبر مستوى التراجع بنسبة 14.6% عند 1.3392 (الخط الأحمر المتقطع)، وبعد ذلك ارتد السعر وأغلق الشمعة الأسبوعية عند 1.3446. في الأسبوع القادم،

Stefan Doll 11:38 2025-06-23 UTC+2

التحليل الفني للأسبوع من 23 إلى 28 يونيو: زوج العملات EUR/USD

في الأسبوع الماضي، تحرك الزوج نحو الأسفل واختبر مستوى التراجع بنسبة 76.4% عند 1.1452 (الخط الأحمر المتقطع)، وبعد ذلك ارتد السعر وأغلق الشمعة الأسبوعية عند 1.1520. في الأسبوع القادم،

Stefan Doll 11:31 2025-06-23 UTC+2

التوقعات لليورو/الدولار الأمريكي في 23 يونيو 2025

يوم الجمعة، واصل زوج اليورو/الدولار الأمريكي الارتفاع بعد الارتداد من مستوى التصحيح 76.4% عند 1.1454. ومع ذلك، في ليلة الاثنين، عاد الزوج إلى هذا المستوى. يسمح الارتداد الجديد بتوقعات

Samir Klishi 11:24 2025-06-23 UTC+2

التوقعات لزوج الجنيه الإسترليني/الدولار الأمريكي في 23 يونيو 2025

على الرسم البياني الساعي، استقر زوج الجنيه الإسترليني/الدولار الأمريكي يوم الجمعة تحت منطقة الدعم 1.3425–1.3444، مما يسمح مرة أخرى بتوقع استمرار الانخفاض نحو مستوى الدعم 1.3357–1.3373. الارتداد من هذه المنطقة

Samir Klishi 11:19 2025-06-23 UTC+2

التحليل الفني لحركة السعر اليومية لأزواج العملات الغريبة USD/IDR، الاثنين 23 يونيو 2025.

16473.27 حاليًا على الرسم البياني اليومي، يظهر زوج العملات الغريب USD/IDR نمط صعودي 123 مما يشير إلى أن USD/IDR يشهد حاليًا تعزيزًا، حيث يتم تأكيد ذلك أيضًا من خلال حركة

Arief Makmur 07:29 2025-06-23 UTC+2

التحليل الفني لحركة السعر اللحظية لأداة سلعة النفط الخام، الاثنين 23 يونيو 2025.

بالإضافة إلى ظهور تباعد بين حركة سعر النفط الخام ومؤشر المذبذب العشوائي على الرسم البياني لمدة 4 ساعات، هناك أيضًا نمط هبوطي 123 ونمط مثلث حيث تشير كل هذه الحقائق

Arief Makmur 07:29 2025-06-23 UTC+2

توقعات EUR/USD ليوم 23 يونيو 2025

تشكل تباين هبوطي على الرسم البياني الأسبوعي لليورو. نحن نستعد لانعكاس نحو اتجاه هبوطي طويل الأجل، لكن التباينات مع الفجوة غالبًا ما تتطور بطريقة معقدة. وبالتالي، قد يستمر السعر

Laurie Bailey 05:00 2025-06-23 UTC+2

توقعات GBP/USD ليوم 23 يونيو 2025

افتتح الجنيه الإسترليني الأسبوع الجديد بفجوة هبوطية، والتي لا تزال تحافظ على التفاؤل الصعودي. لا يزال هناك احتمال لعودة السعر فوق مستوى المقاومة عند 1.3433، مما يبقي الهدف السابق

Laurie Bailey 04:56 2025-06-23 UTC+2

توقعات النفط ليوم 23 يونيو 2025

على الرسم البياني الأسبوعي، بدأت خط الإشارة لمذبذب مارلين في الانعكاس من مستوى 9.3600. تاريخياً، كان هذا المستوى يشير إلى انعكاسات هبوطية كبيرة - في أبريل 2023، أكتوبر 2021، وأبريل

Laurie Bailey 04:56 2025-06-23 UTC+2
لا تستطيع التحدث الآن؟
اطرح سؤالك في الدردشة.
Widget callback
 

Dear visitor,

Your IP address shows that you are currently located in the USA. If you are a resident of the United States, you are prohibited from using the services of InstaFintech Group including online trading, online transfers, deposit/withdrawal of funds, etc.

If you think you are seeing this message by mistake and your location is not the US, kindly proceed to the website. Otherwise, you must leave the website in order to comply with government restrictions.

Why does your IP address show your location as the USA?

  • - you are using a VPN provided by a hosting company based in the United States;
  • - your IP does not have proper WHOIS records;
  • - an error occurred in the WHOIS geolocation database.

Please confirm whether you are a US resident or not by clicking the relevant button below. If you choose the wrong option, being a US resident, you will not be able to open an account with InstaForex anyway.

We are sorry for any inconvenience caused by this message.