empty
09.01.2024 11:08 AM
EUR/USD and GBP/USD: Trading plan for beginner traders on January 9, 2024

Details of the Economic Calendar on January 8

Eurozone retail sales decreased by 0.3% in November compared to the previous month, matching analysts' forecasts.

In terms of the information flow, there were speeches by Federal Reserve representatives. One of them expressed the opinion about a possible increase in the refinancing rate in case of inflation growth in the USA, while another head of the Federal Reserve Bank, on the contrary, considers an early reduction of the key rate.

Analysis of Trading Charts from January 8

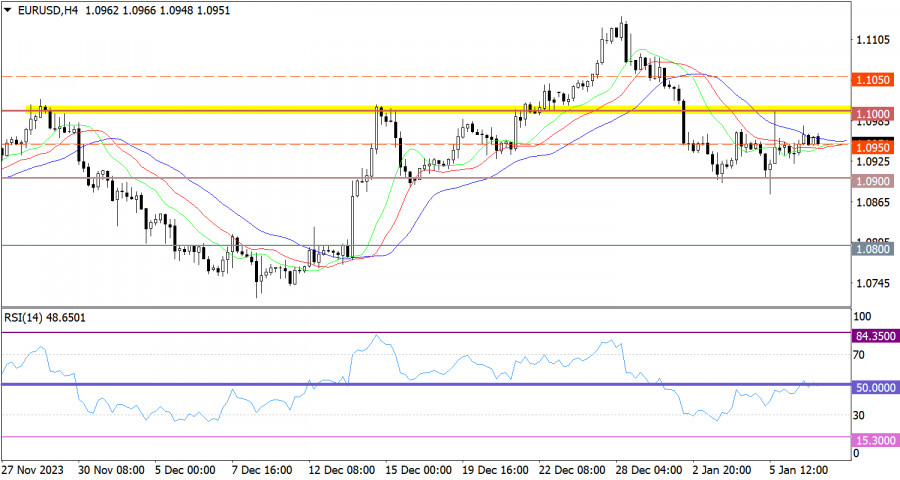
The EUR/USD currency pair has been relatively stable since last Friday, forming doji candles on the daily chart. This price action indicates a characteristic stagnation, which could lead to an accumulation of trading forces.

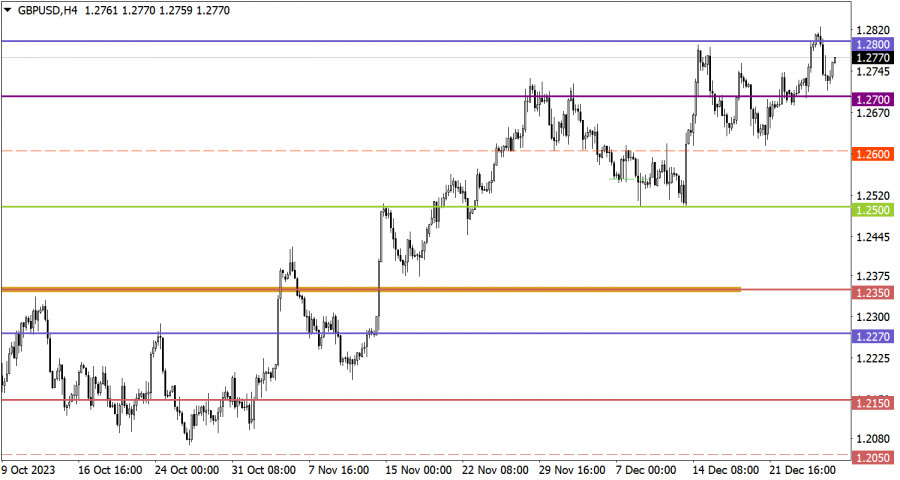
The GBP/USD currency pair shows an upward trend over several days. However, when examining the trading chart over several weeks, a characteristic flat is observed between the levels of 1.2600 and 1.2700.

This image is no longer relevant

Economic Calendar on January 9

Today, the main focus should be on the unemployment rate in the European Union, which is expected to rise from 6.5% to 6.6%. This could potentially lead to some weakening of the euro if the data matches the statistics.

EUR/USD Trading Plan for January 9

Prolonged stagnation at one level can eventually lead to speculative price jumps. For this reason, the current stagnation should be considered as a lever for subsequent price movements. The optimal approach is the method of outgoing impulse, which takes into account a local spike in activity.

This image is no longer relevant

GBP/USD Trading Plan for January 9

In this case, the upward cycle began from the lower boundary at 1.2600. It is possible that near the 1.2700 mark, there will be a reduction in the volume of long positions, which could lead to a slowdown in the upward cycle.

This image is no longer relevant

What's on the charts

The candlestick chart type is white and black graphic rectangles with lines above and below. With a detailed analysis of each individual candle, you can see its characteristics relative to a particular time frame: opening price, closing price, intraday high and low.

Horizontal levels are price coordinates, relative to which a price may stop or reverse its trajectory. In the market, these levels are called support and resistance.

Circles and rectangles are highlighted examples where the price reversed in history. This color highlighting indicates horizontal lines that may put pressure on the asset's price in the future.

The up/down arrows are landmarks of the possible price direction in the future.

Gven Podolsky,
الخبير التحليلي لدى شركة إنستافوركس
© 2007-2025
حدد الإطار الزمني
5
د
15
د
30
د
1
س
4
ساعات
1
يوم
1
أسبوع
كسب عائد من تغيرات أسعار العملات المشفرة مع إنستافوركس.
قم بتحميل منصة التداول ميتاتريدر 4 وافتح أول صفقة.
  • Grand Choice
    Contest by
    InstaForex
    InstaForex always strives to help you
    fulfill your biggest dreams.
    انضم إلى المسابقة

المقالات الموصى بها

توصيات وتحليل التداول لزوج الجنيه الإسترليني/الدولار الأمريكي في 3 يوليو: تلاعب من أجل انطلاقة جديدة؟

يوم الأربعاء، انهار زوج العملات GBP/USD دون سبب واضح. لم تكن هناك أخبار رئيسية في المملكة المتحدة أو الولايات المتحدة يمكن أن تؤدي إلى انخفاض قيمة الجنيه الإسترليني بنحو

Paolo Greco 03:45 2025-07-03 UTC+2

توصيات وتحليل التداول لليورو/الدولار الأمريكي في 3 يوليو: اليورو يصمد، والجنيه يتراجع

في يوم الأربعاء، تراجع زوج العملات EUR/USD بشكل طفيف ولكنه لم يظهر أي ميل لمتابعة الجنيه الإسترليني، الذي انهار بنحو 200 نقطة. بقي اليورو فوق خط Kijun-sen الحرج ومستوى 1.1750،

Paolo Greco 03:45 2025-07-03 UTC+2

GBP/USD: استراتيجية للجلسة الأمريكية في 2 يوليو (تحليل التداولات الصباحية)

في توقعاتي الصباحية، ركزت على مستوى 1.3713 وخططت لاتخاذ قرارات التداول بناءً عليه. دعونا نلقي نظرة على الرسم البياني لمدة 5 دقائق ونفحص ما حدث. على الرغم من كسر مستوى

Miroslaw Bawulski 18:28 2025-07-02 UTC+2

EUR/USD: استراتيجية للجلسة الأمريكية في 2 يوليو (تحليل التداولات الصباحية)

في توقعاتي الصباحية، قمت بتسليط الضوء على مستوى 1.1763 وخططت لاتخاذ قرارات التداول بناءً عليه. دعونا نلقي نظرة على الرسم البياني لمدة 5 دقائق ونرى ما حدث. لقد انخفض الزوج

Miroslaw Bawulski 18:25 2025-07-02 UTC+2

كيف تتداول زوج الجنيه الإسترليني/الدولار الأمريكي في 2 يوليو؟ نصائح بسيطة وتحليل التداول للمبتدئين

في يوم الثلاثاء، أظهرت زوج العملات GBP/USD أيضًا علامات على استمرار حركتها الصعودية. فقط خلال جلسة التداول الأمريكية تمكن الدولار بطريقة ما من تعزيز موقفه قليلاً، ولكن لا ينبغي اعتبار

Paolo Greco 07:15 2025-07-02 UTC+2

كيفية تداول زوج اليورو/الدولار الأمريكي في 2 يوليو؟ نصائح بسيطة وتحليل التداول للمبتدئين

في يوم الثلاثاء، تداول زوج العملات EUR/USD مرة أخرى مع ميل صعودي وأنهى اليوم بمكاسب. يشير خط الاتجاه الصاعد الجديد إلى استمرار الاتجاه الصعودي الحالي على الإطار الزمني الساعي،

Paolo Greco 07:04 2025-07-02 UTC+2

توصيات وتحليل التداول لزوج الجنيه الإسترليني/الدولار الأمريكي في 2 يوليو: الجنيه يستعد للهبوط—وترامب يستعد للتنحي؟

في يوم الثلاثاء، بدأ زوج العملات GBP/USD حركة هبوطية متواضعة في النصف الثاني من اليوم لكنه بقي فوق خط Kijun-sen الحرج. وبالتالي، لا يوجد حتى الآن أي إشارة على انعكاس

Paolo Greco 03:51 2025-07-02 UTC+2

توصيات وتحليل التداول لليورو/الدولار الأمريكي في 2 يوليو: "اللحظة الأروع" لليورو تستمر

واصل زوج العملات EUR/USD حركته الصعودية يوم الثلاثاء، وهو الارتفاع الذي استأنف مساء الاثنين السابق. وبالتالي، متجاهلاً تمامًا الخلفية الاقتصادية الكلية، يستمر السوق في بيع الدولار الأمريكي بشكل يومي

Paolo Greco 03:51 2025-07-02 UTC+2

GBP/USD: خطة التداول للجلسة الأمريكية في الأول من يوليو (مراجعة التداولات الصباحية)

في توقعاتي الصباحية، ركزت على مستوى 1.3766 وخططت لاتخاذ قرارات التداول من تلك النقطة. دعونا نلقي نظرة على الرسم البياني لمدة 5 دقائق ونرى ما حدث. تشكل اختراق كاذب

Miroslaw Bawulski 18:00 2025-07-01 UTC+2

EUR/USD: خطة التداول للجلسة الأمريكية في الأول من يوليو (مراجعة التداولات الصباحية)

في توقعاتي الصباحية، أشرت إلى مستوى 1.1806 كنقطة مرجعية لاتخاذ قرارات التداول. دعونا نلقي نظرة على الرسم البياني لمدة 5 دقائق ونفحص ما حدث هناك. الارتفاع الذي تلاه اختراق كاذب

Miroslaw Bawulski 17:56 2025-07-01 UTC+2
لا تستطيع التحدث الآن؟
اطرح سؤالك في الدردشة.
Widget callback
 

Dear visitor,

Your IP address shows that you are currently located in the USA. If you are a resident of the United States, you are prohibited from using the services of InstaFintech Group including online trading, online transfers, deposit/withdrawal of funds, etc.

If you think you are seeing this message by mistake and your location is not the US, kindly proceed to the website. Otherwise, you must leave the website in order to comply with government restrictions.

Why does your IP address show your location as the USA?

  • - you are using a VPN provided by a hosting company based in the United States;
  • - your IP does not have proper WHOIS records;
  • - an error occurred in the WHOIS geolocation database.

Please confirm whether you are a US resident or not by clicking the relevant button below. If you choose the wrong option, being a US resident, you will not be able to open an account with InstaForex anyway.

We are sorry for any inconvenience caused by this message.