


signal strength 1 of 5

On the chart of the GOLD M5 trading instrument, the Triple Top pattern that signals a trend change has formed. It is possible that after formation of the third peak, the price will try to break through the resistance level 3381.38, where we advise to open a trading position for sale. Take profit is the projection of the pattern’s width, which is 1420 points.
The M5 and M15 time frames may have more false entry points.
- All
- Double Top
- Flag
- Head and Shoulders
- Pennant
- Rectangle
- Triangle
- Triple top
- All
- #AAPL
- #AMZN
- #Bitcoin
- #EBAY
- #FB
- #GOOG
- #INTC
- #KO
- #MA
- #MCD
- #MSFT
- #NTDOY
- #PEP
- #TSLA
- #TWTR
- AUDCAD
- AUDCHF
- AUDJPY
- AUDUSD
- EURCAD
- EURCHF
- EURGBP
- EURJPY
- EURNZD
- EURRUB
- EURUSD
- GBPAUD
- GBPCHF
- GBPJPY
- GBPUSD
- GOLD
- NZDCAD
- NZDCHF
- NZDJPY
- NZDUSD
- SILVER
- USDCAD
- USDCHF
- USDJPY
- USDRUB
- All
- M5
- M15
- M30
- H1
- D1
- All
- Buy
- Sale
- All
- 1
- 2
- 3
- 4
- 5
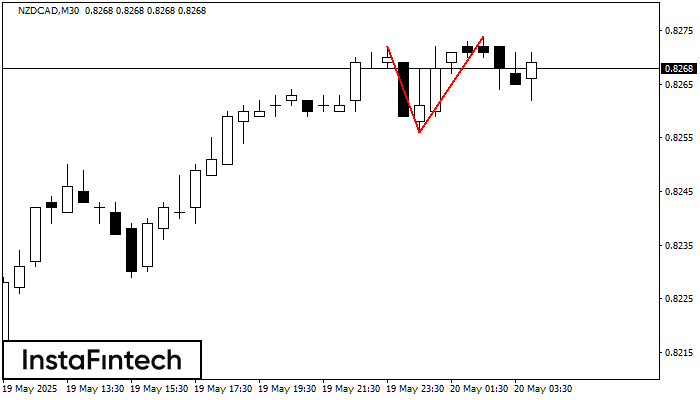
The Double Top pattern has been formed on NZDCAD M30. It signals that the trend has been changed from upwards to downwards. Probably, if the base of the pattern 0.8256
Open chart in a new window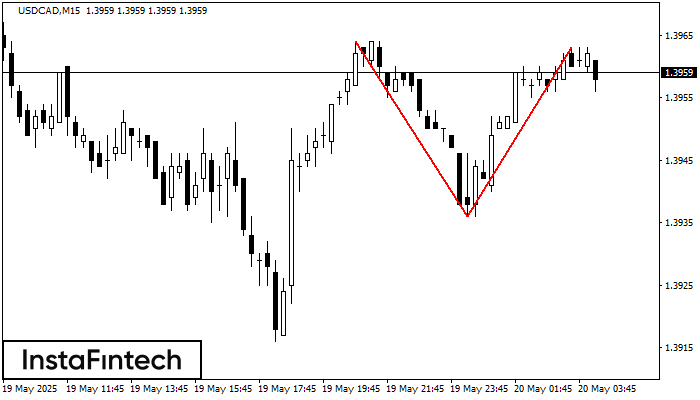
The Double Top pattern has been formed on USDCAD M15. It signals that the trend has been changed from upwards to downwards. Probably, if the base of the pattern 1.3936
The M5 and M15 time frames may have more false entry points.
Open chart in a new window
According to the chart of M15, AUDCHF formed the Bullish Rectangle. This type of a pattern indicates a trend continuation. It consists of two levels: resistance 0.5391 and support 0.5382
The M5 and M15 time frames may have more false entry points.
Open chart in a new window


