empty
29.02.2024 02:37 PM
USD/CAD: trading scenarios on February 29, 2024

This image is no longer relevant

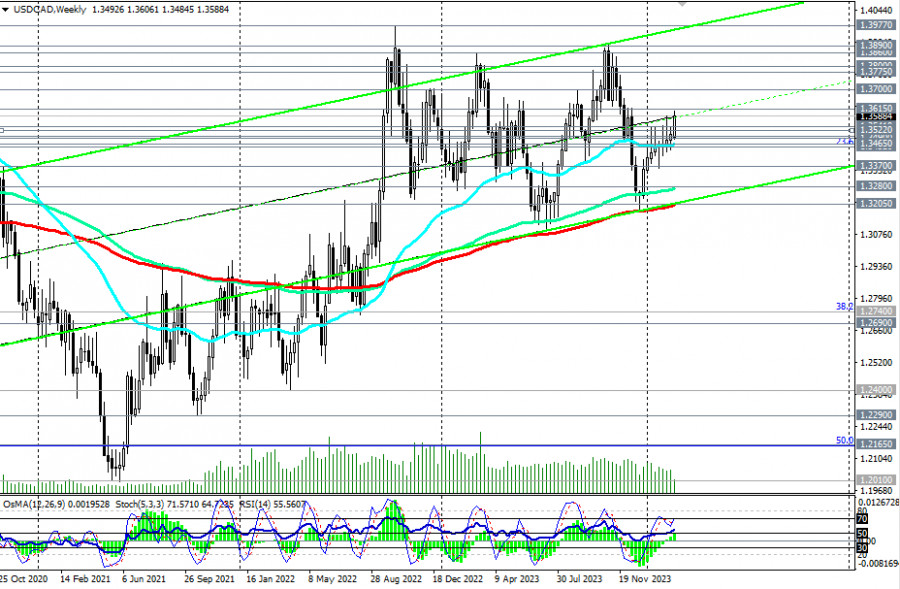
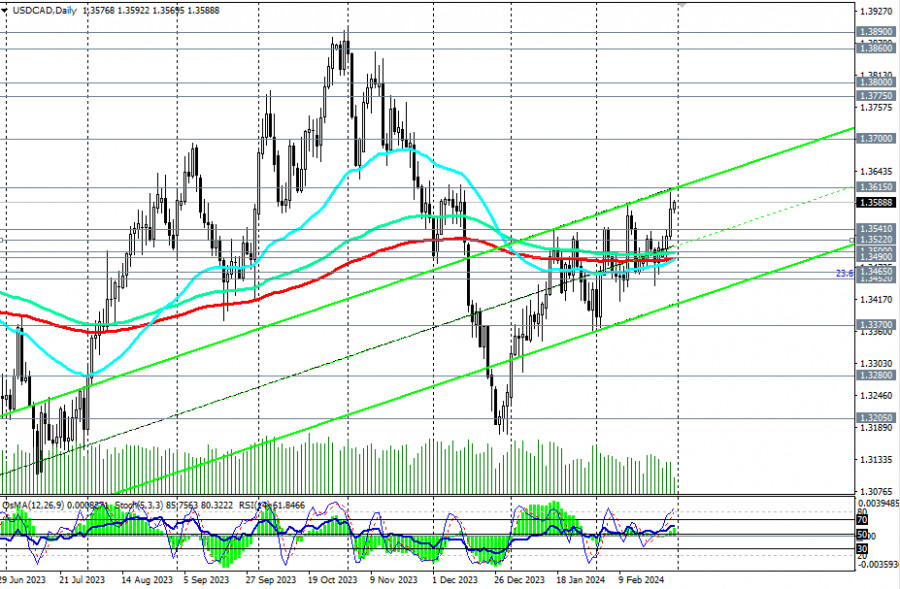
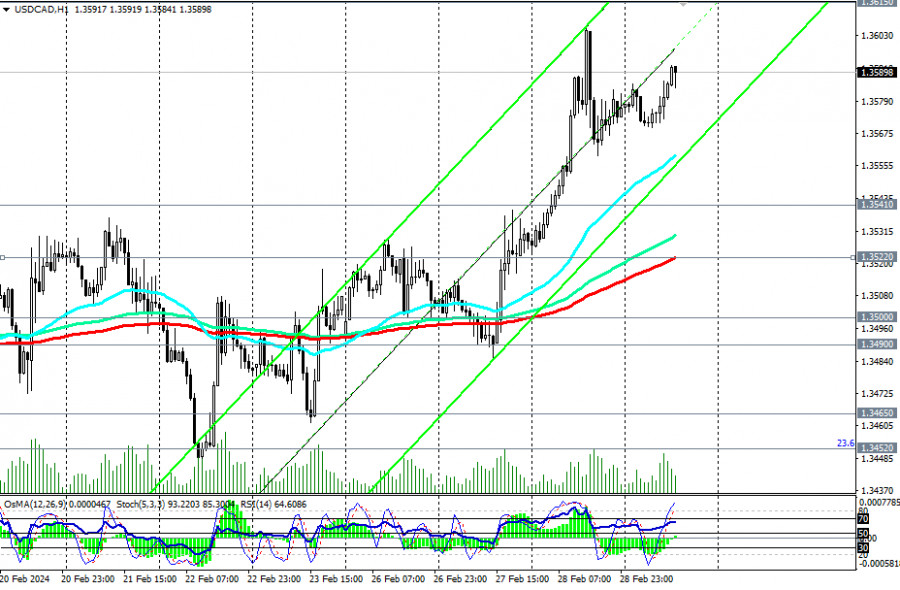
USD/CAD is currently developing positive dynamics within the upward channels on the daily and weekly charts after rebounding from the zone of key support levels at 1.3490 (200 EMA, 50 EMA on the daily chart), 1.3500 (144 EMA on the daily chart), and overcoming the resistance level of 1.3540 yesterday. The price seems to have finally broken out of the range formed between the levels 1.3450 and 1.3540, in which USD/CAD has been trading since mid-January.

This image is no longer relevant

A breakthrough of the next local resistance level at 1.3615 will confirm the bulls' intention to push the pair towards the upper boundary of the upward channel on the weekly chart and the highs of October–November of the previous year, near the 1.3900 mark.

Intermediate targets, in this case, will be located near the levels 1.3700, 1.3780, 1.3800, and 1.3860.

This image is no longer relevant

In an alternative scenario, a decline within the aforementioned upward channels and towards key supports at levels 1.3500, 1.3490 will resume.

A breakthrough of these levels and the important support level at 1.3452 (23.6% Fibonacci retracement level in the growth wave from the level of 0.9700 to the level of 1.4600, reached in June 2016) will bring USD/CAD back into the medium-term bearish market zone.

The first signal for the implementation of this scenario could be a breakthrough of today's low at 1.3570.

Increased volatility in the USD/CAD pair can be expected at 13:30 GMT.

Support levels: 1.3570, 1.3540, 1.3522, 1.3500, 1.3490, 1.3465, 1.3452, 1.3400, 1.3370, 1.3300, 1.3280, 1.3200

Resistance levels: 1.3600, 1.3615, 1.3700, 1.3775, 1.3800, 1.3860, 1.3890, 1.3900, 1.3970, 1.4000

Trading Scenarios:

Main Scenario: Buy at the market, Buy Stop at 1.3620. Stop-Loss at 1.3560. Targets at 1.3700, 1.3775, 1.3800, 1.3860, 1.3890, 1.3900, 1.3970, 1.4000.

Alternative Scenario: Sell Stop at 1.3560. Stop-Loss at 1.3620. Targets at 1.3540, 1.3522, 1.3500, 1.3490, 1.3465, 1.3452, 1.3400, 1.3370, 1.3300, 1.3280, 1.3200.

"Targets" correspond to support/resistance levels. This also does not imply that they will necessarily be reached but can serve as a guide in planning and placing trading positions.

Jurij Tolin,
ইন্সটাফরেক্সের বিশ্লেষণ বিশেষজ্ঞ
© 2007-2025
টাইমফ্রেম নির্বাচন করুন
5
মিনিট
15
মিনিট
30
মিনিট
1
ঘন্টা
4
ঘন্টা
1
দিন
1
সপ্তাহ
ইনস্টাফরেক্স দিয়ে ক্রিপ্টোমুদ্রা দর পরিবর্তনে আয় করুন।
মেটাট্রেডার 4 ডাউনলোড করে আপনার প্রথম ট্রেড চালু করুন।
  • Grand Choice
    Contest by
    InstaForex
    InstaForex always strives to help you
    fulfill your biggest dreams.
    প্রতিযোগীতায় অংশগ্রহণ করুন

সুপারিশকৃত নিবন্ধ

GBP/USD পেয়ারের ট্রেডিংয়ের পরামর্শ ও বিশ্লেষণ, ২৮ মে: সামান্য কারেকশন কোনো ব্যাপার না

মঙ্গলবার EUR/USD পেয়ারের মতো একই কারণে GBP/USD কারেন্সি পেয়ারের মূল্যও নিম্নমুখী হয়েছে। তবে এটি বলা যাবে না যে ব্রিটিশ মুদ্রার বড় ধরনের দরপতন ঘটেছে — যেকোনো মুহূর্তে আবার ঊর্ধ্বমুখী মুভমেন্ট

Paolo Greco 06:16 2025-05-28 UTC+2

EUR/USD পেয়ারের ট্রেডিংয়ের পরামর্শ ও বিশ্লেষণ, ২৮ মে: ডলারের মূল্যের ঊর্ধ্বমুখী প্রবণতা স্বল্পমেয়াদী হতে পারে

মঙ্গলবার EUR/USD কারেন্সি পেয়ারের মূল্যের তুলনামূলকভাবে লক্ষণীয় একটি নিম্নমুখী মুভমেন্ট পরিলক্ষিত হয়েছে। তবে এই মুভমেন্ট সামগ্রিক প্রবণতা, বাজার পরিস্থিতি, কিংবা বৃহত্তর প্রেক্ষাপটে কোনো প্রভাব ফেলেনি। মার্কিন ডলারের মূল্য বৃদ্ধি পেতে

Paolo Greco 05:27 2025-05-28 UTC+2

২৭ মে কীভাবে GBP/USD পেয়ারের ট্রেডিং করবেন? নতুন ট্রেডারদের জন্য ট্রেডিংয়ের সহজ টিপস ও বিশ্লেষণ

সোমবারের ট্রেডের বিশ্লেষণ GBP/USD পেয়ারের 1H চার্ট সোমবার GBP/USD পেয়ারের মূল্য 1.3580 লেভেলে পৌঁছায় — যা গত তিন বছরের মধ্যে ব্রিটিশ পাউন্ডের সর্বোচ্চ মূল্য। যেমনটি আমরা আগেও বলেছি

Paolo Greco 12:22 2025-05-27 UTC+2

২৭ মে কীভাবে EUR/USD পেয়ারের ট্রেডিং করবেন? নতুন ট্রেডারদের জন্য ট্রেডিংয়ের সহজ টিপস ও বিশ্লেষণ

সোমবারের ট্রেডের বিশ্লেষণ EUR/USD পেয়ারের 1H চার্ট সোমবার EUR/USD কারেন্সি পেয়ারের মূল্যের ঊর্ধ্বমুখী মুভমেন্ট অব্যাহত ছিল, যা শুক্রবার থেকেই শুরু হয়েছিল। কেবল দিনের দ্বিতীয়ার্ধে একটি স্বল্পমেয়াদি কারেকশন দেখা যায়, যার

Paolo Greco 12:06 2025-05-27 UTC+2

GBP/USD পেয়ারের ট্রেডিংয়ের পরামর্শ ও বিশ্লেষণ, ২৭ মে: হতাশ হওয়ার কোনো কারণ নেই

GBP/USD পেয়ারের 5-মিনিটের চার্টের বিশ্লেষণ সোমবারও ঊর্ধ্বমুখী প্রবণতার সাথে GBP/USD কারেন্সি পেয়ারের ট্রেড করা হয়েছে, যদিও দিনের বেলা সামান্য কারেকশন হতে দেখা গেছে। এই কারেকশনটি হয় সেই ঘোষণার

Paolo Greco 11:47 2025-05-27 UTC+2

EUR/USD পেয়ারের ট্রেডিংয়ের পরামর্শ ও বিশ্লেষণ, ২৭ মে: মার্কেটের ট্রেডাররা রাগান্বিত হতে শুরু করেছে

১ জুন থেকে ইউরোপীয় পণ্যের ওপর শুল্ক ৫০% পর্যন্ত বাড়ানো হবে ট্রাম্পের এই ঘোষণার পর সোমবার দিনের শুরুতে EUR/USD কারেন্সি পেয়ারের মূল্য ঊর্ধ্বমুখী হয়। তবে, ইউরোপীয় কমিশনের প্রেসিডেন্ট উরসুলা

Paolo Greco 11:01 2025-05-27 UTC+2

২৬ মে কীভাবে GBP/USD পেয়ারের ট্রেডিং করবেন? নতুন ট্রেডারদের জন্য ট্রেডিংয়ের সহজ টিপস ও বিশ্লেষণ

শুক্রবার GBP/USD পেয়ারের মূল্যও আত্মবিশ্বাসের সাথে ঊর্ধ্বমুখী হয়েছে, যা গত দুই সপ্তাহ ধরে গঠিত সামগ্রিক ঊর্ধ্বমুখী প্রবণতার ধারাবাহিকতা এবং ইউরোপীয় ইউনিয়ন থেকে আমদানিকৃত পণ্যের ওপর ৫০% শুল্ক আরোপের ট্রাম্পের ঘোষণার

Paolo Greco 09:10 2025-05-26 UTC+2

২৬ মে কীভাবে EUR/USD পেয়ারের ট্রেডিং করবেন? নতুন ট্রেডারদের জন্য ট্রেডিংয়ের সহজ টিপস ও বিশ্লেষণ

শুক্রবারের ট্রেডের বিশ্লেষণ EUR/USD পেয়ারের 1H চার্ট শুক্রবার স্বল্পমেয়াদি কারেকশন শেষে EUR/USD কারেন্সি পেয়ারের মূল্য 1.1267 লেভেল থেকে আবারও ঊর্ধ্বমুখী হয়েছে। ট্রেন্ডলাইনের নির্দেশনা অনুযায়ী এই পেয়ারের মূল্যের ঊর্ধ্বমুখী প্রবণতা এখনো

Paolo Greco 08:56 2025-05-26 UTC+2

GBP/USD পেয়ারের ট্রেডিংয়ের পরামর্শ ও বিশ্লেষণ, ২৬ মে: পুনরায় ব্রিটিশ পাউন্ডের দর বৃদ্ধি পেয়েছে

GBP/USD কারেন্সি পেয়ারের মূল্য সাইডওয়েজ চ্যানেলের উপরের সীমানা ব্রেক ঊর্ধ্বমুখী হয়েছে, তারপর ট্রাম্পের কাছ থেকে নতুন আগ্রাসী পদক্ষেপের অপেক্ষায় কিছুক্ষণের জন্য ঊর্ধ্বমুখী মুভমেন্ট থেমে যায়, তারপর আত্মবিশ্বাসের সাথে এই পেয়ারের

Paolo Greco 06:53 2025-05-26 UTC+2

EUR/USD পেয়ারের ট্রেডিংয়ের পরামর্শ ও বিশ্লেষণ, ২৬ মে: নতুন করে ডলারের মূল্যে ধ্বস নেমেছে

শুক্রবার ঊর্ধ্বমুখী প্রবণতার সাথে EUR/USD কারেন্সি পেয়ারের ট্রেড করা হয়েছে। টানা দুই সপ্তাহ ধরে ডলার দরপতন হচ্ছে, এবং মার্কেটে বছরের শুরুতে শুরু হওয়া ঊর্ধ্বমুখী প্রবণতা আবার শুরু হওয়ার এক অবিরাম

Paolo Greco 05:50 2025-05-26 UTC+2
এখন কথা বলতে পারবেন না?
আপনার প্রশ্ন জিজ্ঞাসা করুন চ্যাট.
Widget callback
 

Dear visitor,

Your IP address shows that you are currently located in the USA. If you are a resident of the United States, you are prohibited from using the services of InstaFintech Group including online trading, online transfers, deposit/withdrawal of funds, etc.

If you think you are seeing this message by mistake and your location is not the US, kindly proceed to the website. Otherwise, you must leave the website in order to comply with government restrictions.

Why does your IP address show your location as the USA?

  • - you are using a VPN provided by a hosting company based in the United States;
  • - your IP does not have proper WHOIS records;
  • - an error occurred in the WHOIS geolocation database.

Please confirm whether you are a US resident or not by clicking the relevant button below. If you choose the wrong option, being a US resident, you will not be able to open an account with InstaForex anyway.

We are sorry for any inconvenience caused by this message.