


signal strength 1 of 5
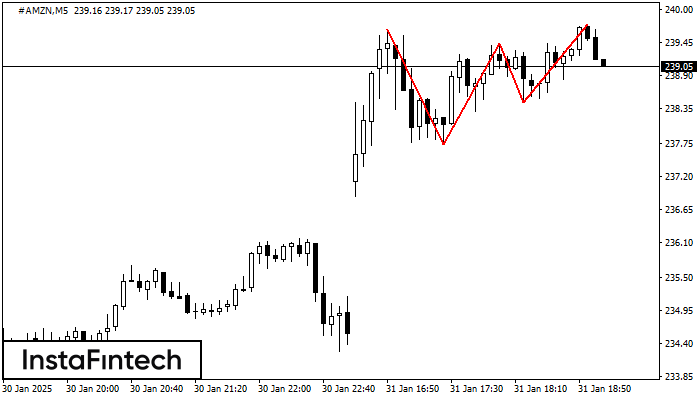
The Triple Top pattern has formed on the chart of the #AMZN M5 trading instrument. It is a reversal pattern featuring the following characteristics: resistance level -8, support level -71, and pattern’s width 193. Forecast If the price breaks through the support level 237.74, it is likely to move further down to 239.29.
The M5 and M15 time frames may have more false entry points.
আরও দেখুন
- All
- Double Top
- Flag
- Head and Shoulders
- Pennant
- Rectangle
- Triangle
- Triple top
- All
- #AAPL
- #AMZN
- #Bitcoin
- #EBAY
- #FB
- #GOOG
- #INTC
- #KO
- #MA
- #MCD
- #MSFT
- #NTDOY
- #PEP
- #TSLA
- #TWTR
- AUDCAD
- AUDCHF
- AUDJPY
- AUDUSD
- EURCAD
- EURCHF
- EURGBP
- EURJPY
- EURNZD
- EURRUB
- EURUSD
- GBPAUD
- GBPCHF
- GBPJPY
- GBPUSD
- GOLD
- NZDCAD
- NZDCHF
- NZDJPY
- NZDUSD
- SILVER
- USDCAD
- USDCHF
- USDJPY
- USDRUB
- All
- M5
- M15
- M30
- H1
- D1
- All
- Buy
- Sale
- All
- 1
- 2
- 3
- 4
- 5
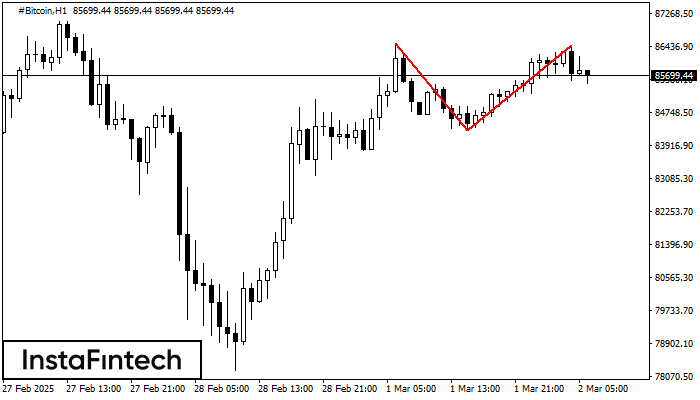
On the chart of #Bitcoin H1 the Double Top reversal pattern has been formed. Characteristics: the upper boundary 86450.98; the lower boundary 84310.46; the width of the pattern 214052 points
Open chart in a new window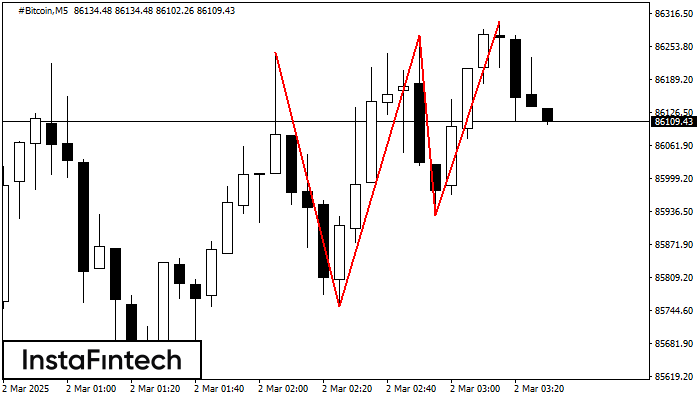
The Triple Top pattern has formed on the chart of the #Bitcoin M5. Features of the pattern: borders have an ascending angle; the lower line of the pattern
The M5 and M15 time frames may have more false entry points.
Open chart in a new window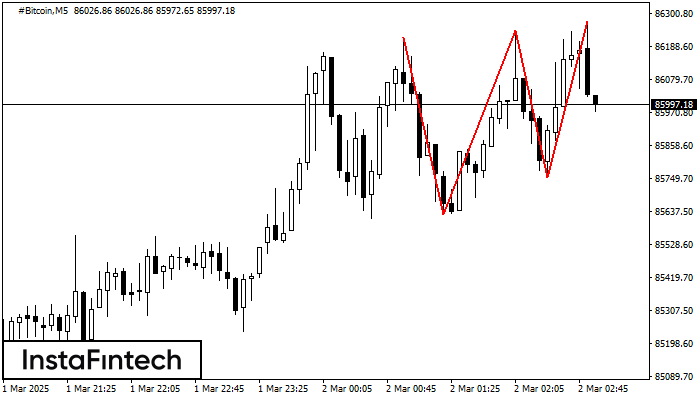
The Triple Top pattern has formed on the chart of the #Bitcoin M5 trading instrument. It is a reversal pattern featuring the following characteristics: resistance level -5334, support level -12291
The M5 and M15 time frames may have more false entry points.
Open chart in a new window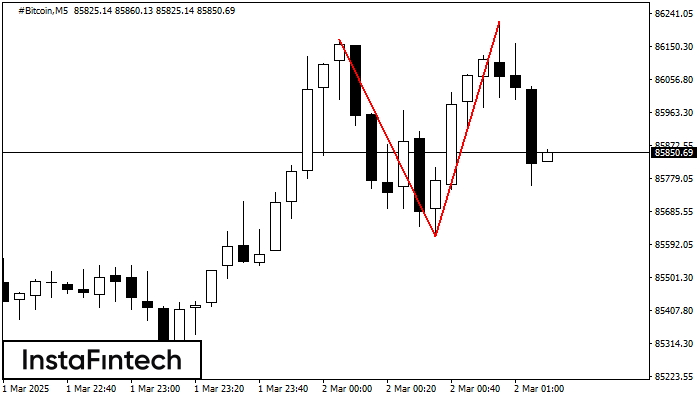
The Double Top reversal pattern has been formed on #Bitcoin M5. Characteristics: the upper boundary 86169.15; the lower boundary 85615.54; the width of the pattern is 60429 points. Sell trades
The M5 and M15 time frames may have more false entry points.
Open chart in a new window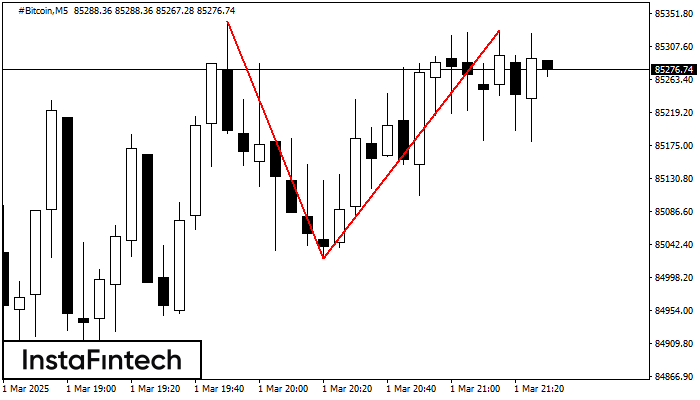
On the chart of #Bitcoin M5 the Double Top reversal pattern has been formed. Characteristics: the upper boundary 85329.59; the lower boundary 85024.15; the width of the pattern 30544 points
The M5 and M15 time frames may have more false entry points.
Open chart in a new window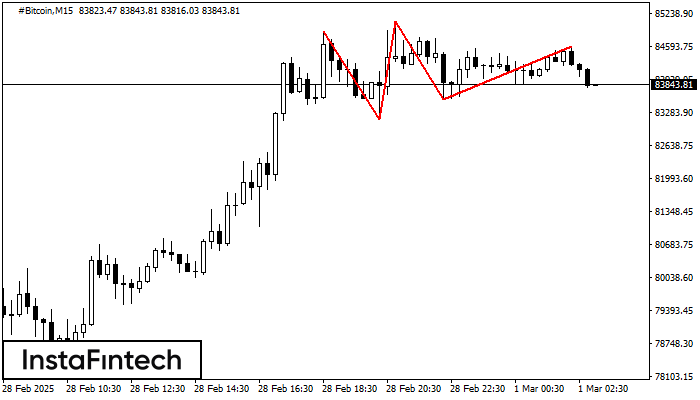
The Triple Top pattern has formed on the chart of the #Bitcoin M15. Features of the pattern: borders have an ascending angle; the lower line of the pattern
The M5 and M15 time frames may have more false entry points.
Open chart in a new window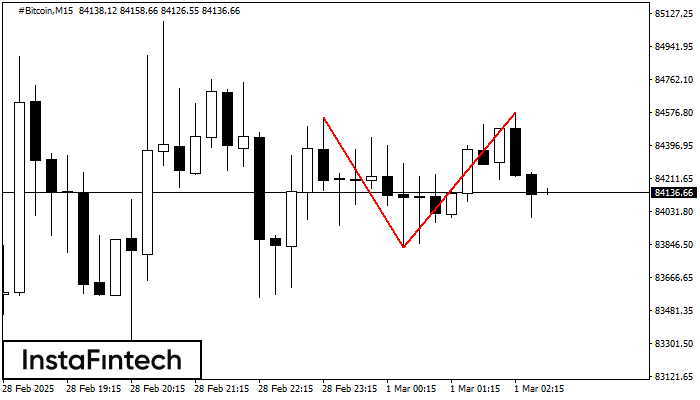
The Double Top pattern has been formed on #Bitcoin M15. It signals that the trend has been changed from upwards to downwards. Probably, if the base of the pattern 83834.36
The M5 and M15 time frames may have more false entry points.
Open chart in a new window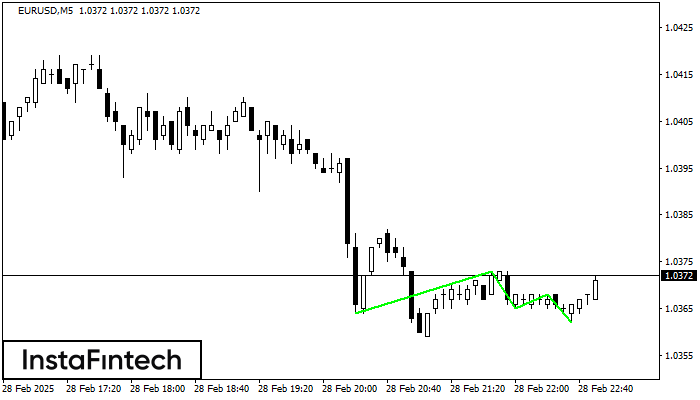
The Triple Bottom pattern has been formed on EURUSD M5. It has the following characteristics: resistance level 1.0373/1.0368; support level 1.0364/1.0362; the width is 9 points. In the event
The M5 and M15 time frames may have more false entry points.
Open chart in a new window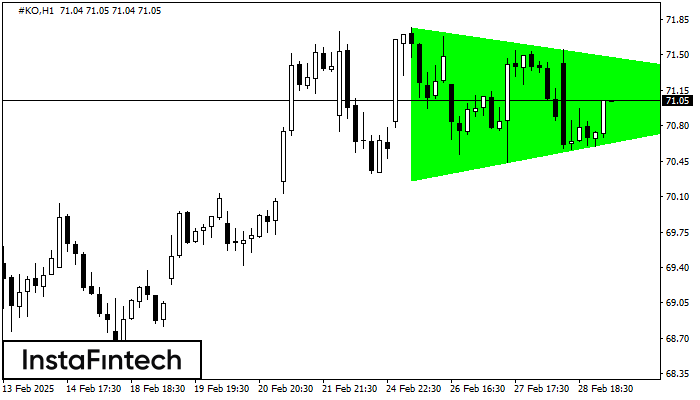
According to the chart of H1, #KO formed the Bullish Symmetrical Triangle pattern. The lower border of the pattern touches the coordinates 70.26/71.11 whereas the upper border goes across 71.77/71.11
Open chart in a new window


