GBP/USD 5-Minute Analysis
The GBP/USD pair continued its decline on Tuesday. Just yesterday, we noted that the pause in the pound's fall couldn't last long. Tuesday proved us right. The pound had risen without justification, much like the euro over the past two years. The only reason for the pound's growth during this period was the market pricing in the future easing of U.S. monetary policy. Since September 18, the pound has declined, with no other scenarios in play. While the pound still shows some resistance to the dollar, it's evident that it lacks any supporting factors. The sterling was artificially inflated to extreme levels, but such trends cannot last forever.
Tuesday's events again highlighted the lack of positivity in the UK economy. Unemployment rose by 0.3% in September, seemingly out of nowhere. How, then, is the British economy better or stronger than the U.S. economy, which experts have been predicting doom for throughout 2024? The U.S. has no recession, while the UK economy hasn't grown for two years. It's also evident that if the Bank of England isn't rushing to lower interest rates now, it will have to cut them even faster. The market has entirely ignored this factor over the past two years. As such, we believe the pound sterling will continue falling against the dollar. The pound has been in a 16-year downtrend, and we currently see no reason for ending it.
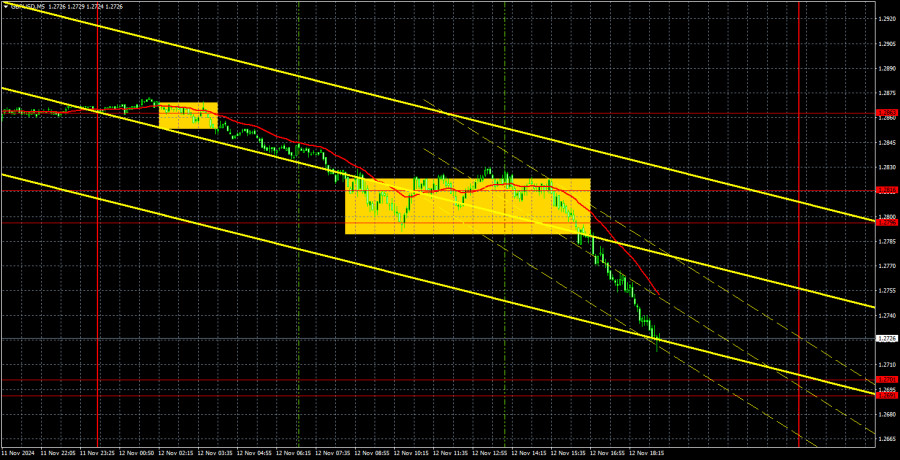
Two sell signals were formed in the 5-minute time frame yesterday. First, the pair bounced off the 1.2863 level, breaking through the 1.2796–1.2816 zone. The signals weren't perfect, but let's not forget that precision on the forex market is rarely exact. No level consistently reacts to the exact pip. On a downtrend, it's clear that traders should expect further declines and focus on short positions.
COT Report
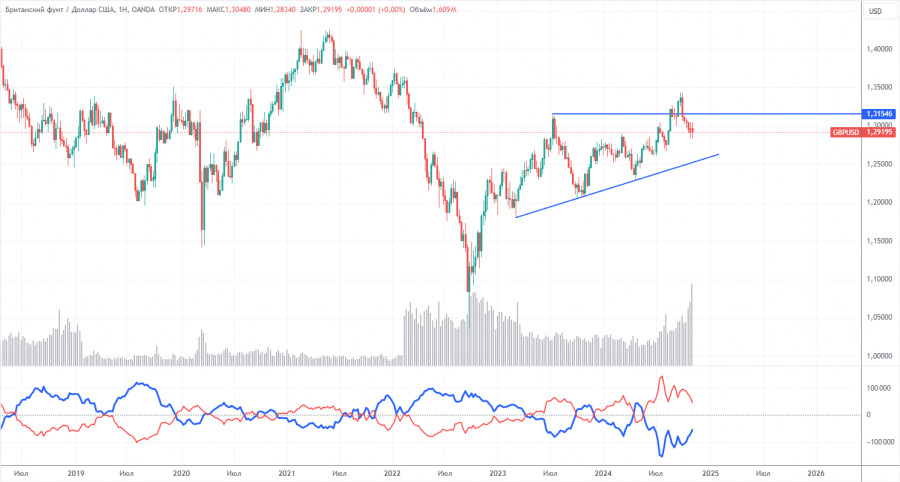
The latest Commitments of Traders (COT) report for the British pound highlights fluctuating sentiment among commercial traders in recent years. The red and blue lines, representing the net positions of commercial and non-commercial traders, frequently intersect and remain near zero. The most recent downtrend coincided with the red line moving below the zero mark. The red line is above zero, and the price has breached the critical level of 1.3154.
The latest COT report shows that the non-commercial group closed 11,900 BUY contracts and opened 9,400 SELL contracts, reducing their net position by 21,300. Despite this, the market remains hesitant to sell the pound in the medium term.
The fundamental backdrop continues not to justify long-term pound purchases. Meanwhile, the currency has a realistic chance of resuming its global downtrend. However, the weekly time frame shows an ascending trendline, so expecting long-term pound depreciation is premature until this line is breached. The pound has been rising against most expectations in the medium term.
GBP/USD 1-Hour Analysis
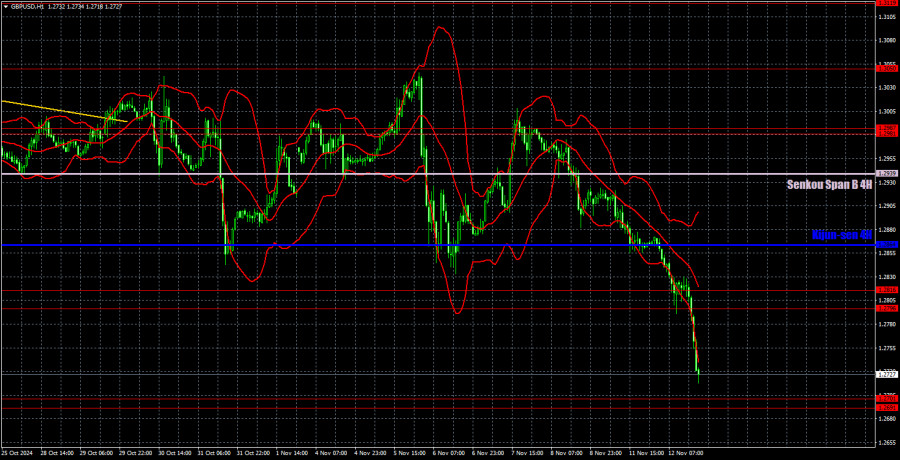
On the hourly time frame, GBP/USD displays a bearish sentiment. The upward trend has been canceled, and further declines in the pound should be expected—both strong and prolonged. The recent correction turned out to be a flat movement and has now concluded. In any case, there's no justification for expecting the dollar to weaken in the medium term. The pound continues to fall without clear reasons, which only confirms our assumptions. When reasons exist (as they did yesterday), the pound falls even more sharply—proving the current market logic.
For November 13, we highlight the following important levels: 1.2796-1.2816, 1.2863, 1.2981-1.2987, 1.3050, 1.3119, 1.3175, 1.3222, 1.3273, 1.3367, and 1.3439. The Senkou Span B (1.2939) and Kijun-sen (1.2864) lines can also be sources of signals. Setting the Stop Loss level to breakeven when the price passes 20 pips in the intended direction is recommended. The lines of the Ichimoku indicator may move during the day, which should be considered when determining trading signals.
No significant events are scheduled in the UK, but a crucial U.S. inflation report will be released. Market reactions could vary. If inflation exceeds 2.6%, further declines in the pair are almost guaranteed.
Chart Explanations:
Support and resistance levels: thick red lines around which movement may end. They are not sources of trading signals.
Kijun-sen and Senkou Span B lines: Ichimoku indicator lines transferred from the 4-hour to the 1-hour timeframe. These are strong lines.
Extreme levels: thin red lines where the price previously rebounded. They are sources of trading signals.
Yellow lines: Trend lines, trend channels, and other technical patterns.
Indicator 1 on COT charts: The net position size for each category of traders.


