

signal strength 1 of 5

The Triple Bottom pattern has been formed on GBPAUD M5. It has the following characteristics: resistance level 2.0835/2.0826; support level 2.0821/2.0823; the width is 14 points. In the event of a breakdown of the resistance level of 2.0835, the price is likely to continue an upward movement at least to 2.0836.
The M5 and M15 time frames may have more false entry points.
- All
- Double Top
- Flag
- Head and Shoulders
- Pennant
- Rectangle
- Triangle
- Triple top
- All
- #AAPL
- #AMZN
- #Bitcoin
- #EBAY
- #FB
- #GOOG
- #INTC
- #KO
- #MA
- #MCD
- #MSFT
- #NTDOY
- #PEP
- #TSLA
- #TWTR
- AUDCAD
- AUDCHF
- AUDJPY
- AUDUSD
- EURCAD
- EURCHF
- EURGBP
- EURJPY
- EURNZD
- EURRUB
- EURUSD
- GBPAUD
- GBPCHF
- GBPJPY
- GBPUSD
- GOLD
- NZDCAD
- NZDCHF
- NZDJPY
- NZDUSD
- SILVER
- USDCAD
- USDCHF
- USDJPY
- USDRUB
- All
- M5
- M15
- M30
- H1
- D1
- All
- Buy
- Sale
- All
- 1
- 2
- 3
- 4
- 5
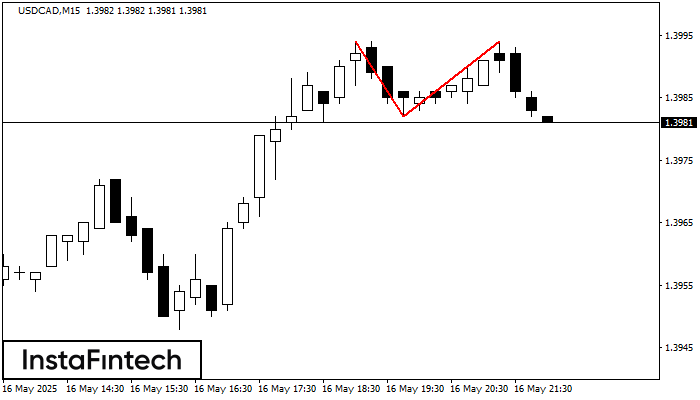
The Double Top pattern has been formed on USDCAD M15. It signals that the trend has been changed from upwards to downwards. Probably, if the base of the pattern 1.3982
The M5 and M15 time frames may have more false entry points.
Open chart in a new window
The Bullish pennant pattern is formed on the #EBAY M30 chart. It is a type of the continuation pattern. Supposedly, in case the price is fixed above the pennant’s high
Open chart in a new window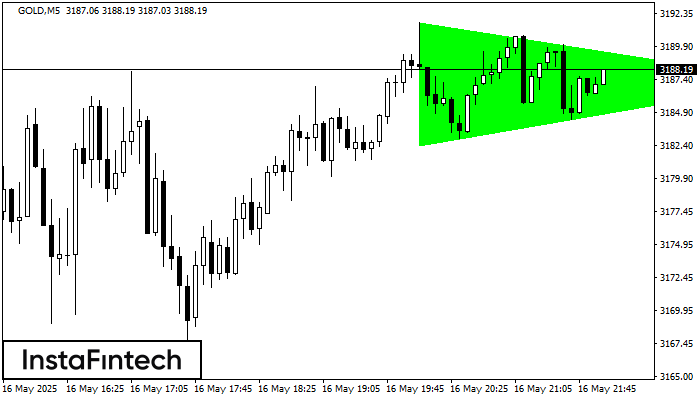
According to the chart of M5, GOLD formed the Bullish Symmetrical Triangle pattern. Description: This is the pattern of a trend continuation. 3191.74 and 3182.45 are the coordinates
The M5 and M15 time frames may have more false entry points.
Open chart in a new window


