empty
21.08.2024 12:54 PM
GBP/USD. August 21. The Pound Exceeds Expectations by a Wide Margin

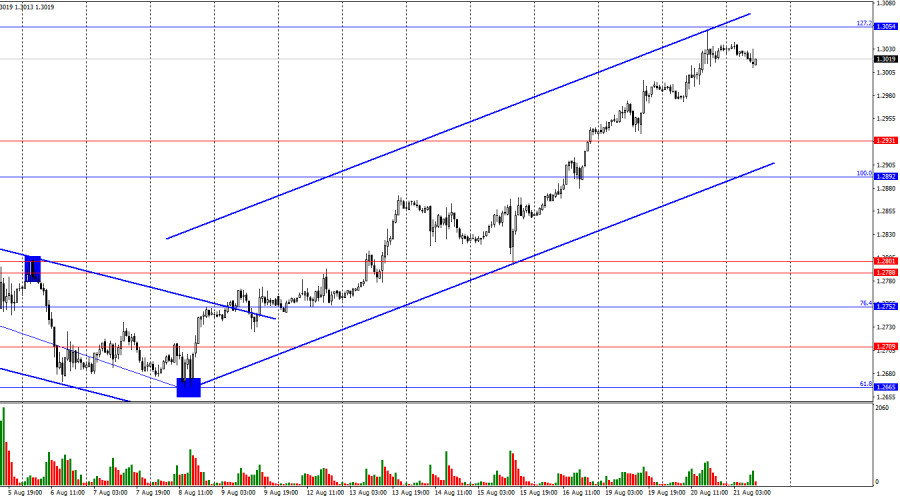
On the hourly chart, the GBP/USD pair continued its upward movement on Tuesday after consolidating above the 1.2931 level. Last evening, the quotes stopped just a few points short of the 127.2% corrective level at 1.3054. This can be considered a rebound, which may indicate a potential reversal in favor of the U.S. dollar and a possible decline towards the 1.2931 level. The upward trend channel allows for such a correction. Consolidating the quotes above the 1.3054 level will increase the likelihood of continued growth toward the next Fibonacci level at 161.8% – 1.3258.

This image is no longer relevant

The wave pattern is clear. The last completed downward wave failed to break the low of the previous wave, while the last upward wave managed to break the previous high by just a few points. Thus, we are currently dealing with a "bullish" trend, but the waves are so large that any trend change might be detected too late. To be confident in the continuation of the "bullish" trend, a firm close above the 1.3054 level is required.

There was no significant news on Tuesday, and today traders are only awaiting the FOMC minutes. The minutes will be released late in the evening and are unlikely to trigger new bullish attacks, as they typically do not contain crucial information. However, the last meeting of the regulator might have included discussions on the need to start easing monetary policy soon. If the minutes reflect an increase in dovish sentiment within the Fed, this could give the dollar another reason to continue its decline. Nevertheless, I expect at least a slight pullback in the pair's value. A corrective wave needs to form, indicators need to be reset, divergences cleared, and Jerome Powell's speech on Friday has already been priced in by the market. I did not see strong reasons for the pair to continue rising on Monday, and there are even fewer reasons on Wednesday, in my opinion.

This image is no longer relevant

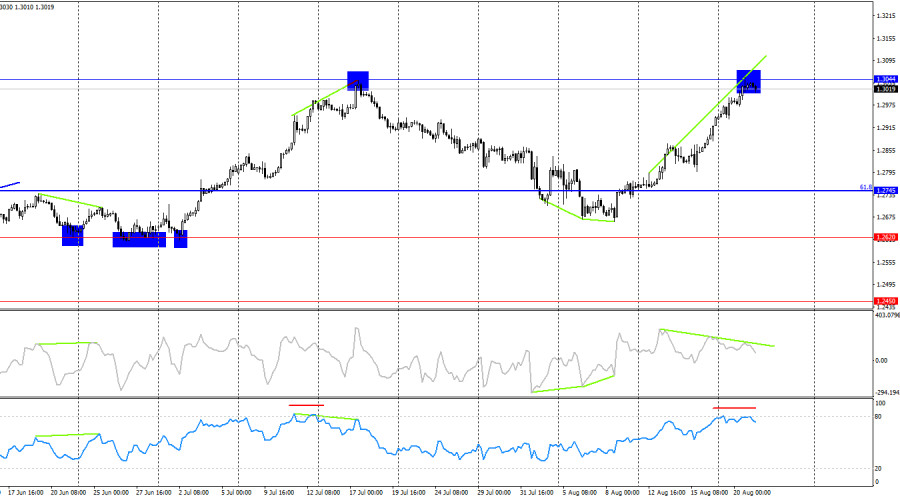
On the 4-hour chart, the pair has risen to the 1.3044 level. A rebound from this level could indicate a reversal in favor of the U.S. dollar and some decline. Besides the rebound, the CCI indicator has been signaling a bearish divergence for a week, and the RSI indicator is in overbought territory, which is rare. Therefore, I would say that the likelihood of the pair declining in the coming days is high. Consolidation above the 1.3044 level will increase the chances of continued growth toward the next Fibonacci level at 76.4% – 1.3314.

Commitments of Traders (COT) Report:

This image is no longer relevant

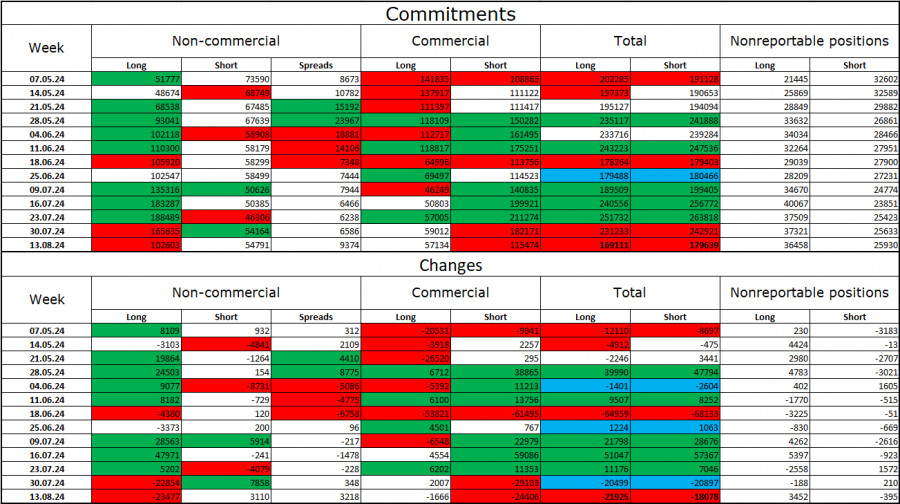
The sentiment of the Non-commercial category of traders has become much less bullish in the last reporting week. The number of long positions held by speculators decreased by 23,477, while the number of short positions increased by 3,110. Bulls still hold a significant advantage. The gap between the number of long and short positions is nearly 50,000, with 102,000 long positions versus 55,000 short positions.

In my view, the pound still faces the prospect of declining, but COT reports suggest otherwise. Over the past three months, the number of long positions has increased from 51,000 to 102,000, while the number of short positions has decreased from 74,000 to 55,000. I believe that over time, professional players will start to offload long positions or increase short positions, as all potential buying factors for the British pound have already been priced in. However, it is important to remember that this is just an assumption. Technical analysis indicates a likely decline in the near future, but that does not mean the decline will last for several months or half a year.

News Calendar for the U.S. and the U.K.:

U.S. – Release of FOMC Minutes (18:00 UTC).

On Wednesday, the economic event calendar contains only one entry. The influence of the news on market sentiment today will be very weak and only in the evening.

Forecast for GBP/USD and Trading Advice:

Selling the pair is possible today on a rebound from the 1.3044 level on the 4-hour chart with targets at 1.2931 and 1.2892. I would not consider new purchases at the moment, but a close above the 1.3044 level would open new horizons for the bulls.

Fibonacci levels are plotted between 1.2892–1.2298 on the hourly chart and between 1.4248–1.0404 on the 4-hour chart.

Samir Klishi,
Analytical expert of InstaForex
© 2007-2025
Select timeframe
5
min
15
min
30
min
1
hour
4
hours
1
day
1
week
Earn on cryptocurrency rate changes with InstaForex
Download MetaTrader 4 and open your first trade
  • Grand Choice
    Contest by
    InstaForex
    InstaForex always strives to help you
    fulfill your biggest dreams.
    JOIN CONTEST

Recommended Stories

USD/JPY: Slowing Inflation in the U.S. Could Pressure the Pair

The Japanese yen fell significantly the day before on unexpected news of a 90-day pause in trade wars. This development supported the dollar, but whether its growth will continue remains

Pati Gani 09:56 2025-04-10 UTC+2

EUR/USD Forecast for April 10, 2025

Yesterday, U.S. President Donald Trump lowered tariffs to 10% for 90 days for countries that did not retaliate to the initial U.S. tariffs (more than 75 in total). Meanwhile, tariffs

Laurie Bailey 05:08 2025-04-10 UTC+2

GBP/USD Forecast for April 10, 2025

On Wednesday, the British pound fully worked through the target range of 1.2816/47, but as expected, it failed to consolidate above that range, instead entering a consolidation phase around this

Laurie Bailey 05:08 2025-04-10 UTC+2

USD/JPY Forecast for April 10, 2025

Yesterday's heightened volatility in USD/JPY failed to change the bearish sentiment—the candle body never closed above the balance line. This morning's decline nearly engulfed yesterday's white candle. The price

Laurie Bailey 05:08 2025-04-10 UTC+2

S&P 500 Forecast for April 10, 2025

The U.S. stock index, the S&P 500, posted one of the largest single-day gains in its history yesterday. It fell just a few points short of the target level

Laurie Bailey 05:08 2025-04-10 UTC+2

Trading Signals for GOLD (XAU/USD) for April 9-11, 2025: sell below $3,075 (21 SMA - 61.8%)

Technically, gold has been oversold since yesterday, so this rebound over the last few hours represents a technical correction. Therefore, we believe there could be consolidation below 3,085

Dimitrios Zappas 16:03 2025-04-09 UTC+2

EUR/USD and GBP/USD – Technical Analysis for April 9

The bulls are attempting to regain control, and we are currently observing increased activity and a push toward the peak of the ongoing correction at 1.1147. A breakout above this

Evangelos Poulakis 10:07 2025-04-09 UTC+2

Technical Analysis of Intraday Price Movement Natural Gas Commodity Instrument, Wednesday, April 09, 2025.

On the 4-hour chart of the Natural Gas commodity instrument, a Bearish 123 pattern appears followed by a Bearish Ross Hook (RH) followed by a Natural Gas price movement below

Arief Makmur 07:11 2025-04-09 UTC+2

Technical Analysis of Intraday Price Movement of USD/CAD Commodity Currency Pair, Wednesday, April 09, 2025.

Although on the 4-hour chart the USD/CAD commodity currency pair is moving in a Bearish channel, but with the formation of a Bullish 123 pattern and being above

Arief Makmur 07:11 2025-04-09 UTC+2

EUR/USD Forecast for April 9, 2025

By the end of Tuesday, the euro gained 45 pips, and during today's Pacific session, it has added roughly the same amount, approaching the target level of 1.1027. If resistance

Laurie Bailey 04:31 2025-04-09 UTC+2
Can't speak right now?
Ask your question in the chat.
Widget callback
 

Dear visitor,

Your IP address shows that you are currently located in the USA. If you are a resident of the United States, you are prohibited from using the services of InstaFintech Group including online trading, online transfers, deposit/withdrawal of funds, etc.

If you think you are seeing this message by mistake and your location is not the US, kindly proceed to the website. Otherwise, you must leave the website in order to comply with government restrictions.

Why does your IP address show your location as the USA?

  • - you are using a VPN provided by a hosting company based in the United States;
  • - your IP does not have proper WHOIS records;
  • - an error occurred in the WHOIS geolocation database.

Please confirm whether you are a US resident or not by clicking the relevant button below. If you choose the wrong option, being a US resident, you will not be able to open an account with InstaForex anyway.

We are sorry for any inconvenience caused by this message.