empty
21.11.2024 06:26 AM
Trading Recommendations and Trade Analysis for GBP/USD on November 21: The Pound Sterling Remains in a Flat

GBP/USD 5-Minute Analysis

This image is no longer relevant

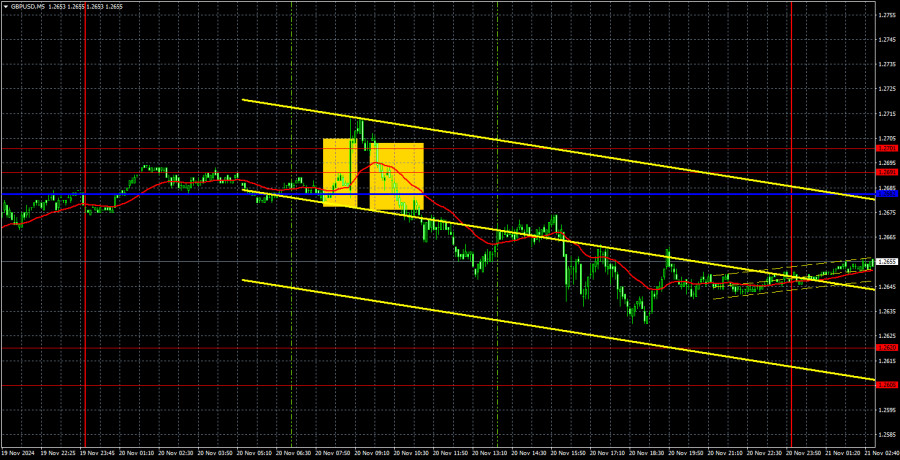
The GBP/USD currency pair continued trading flat on Wednesday. Unlike EUR/USD, however, the flat in GBP/USD is more defined, with clear boundaries. Over the past week, price movements have oscillated between 1.2605–1.2620 and 1.2691–1.2701. The pair consistently tests the upper or lower boundary, providing traders with potential entry points. However, it's worth noting that indicators like Ichimoku lines lose their strength in a flat market.

Wednesday's only notable macroeconomic event was the UK Consumer Price Index (CPI). This report showed an annual inflation rate increase to 2.3%, slightly above expectations. Core inflation also rose to 3.3%, contrary to forecasts of a decline to 3.1%. This confirms Bank of England Governor Andrew Bailey's concerns about accelerating inflation. Consequently, the BoE will likely reduce rates even slower—a positive signal for the pound sterling.

However, Wednesday demonstrated that even strong economic data cannot significantly boost the pound. Despite having solid grounds for growth, the pair failed to break through the upper boundary of the horizontal channel, even when it was within proximity. This reinforces the likelihood of a sustained medium-term decline rather than a corrective rise.

Following the inflation report, the pair broke above the 1.2691–1.2701 range among trading signals. However, this signal turned out to be false. The price fell below this range within an hour, forming a signal aligned with the inflation report, which proved accurate. Subsequently, the pair dropped by 40 pips. However, Wednesday's price movements were neither easily predictable nor consistent.

COT Report

This image is no longer relevant

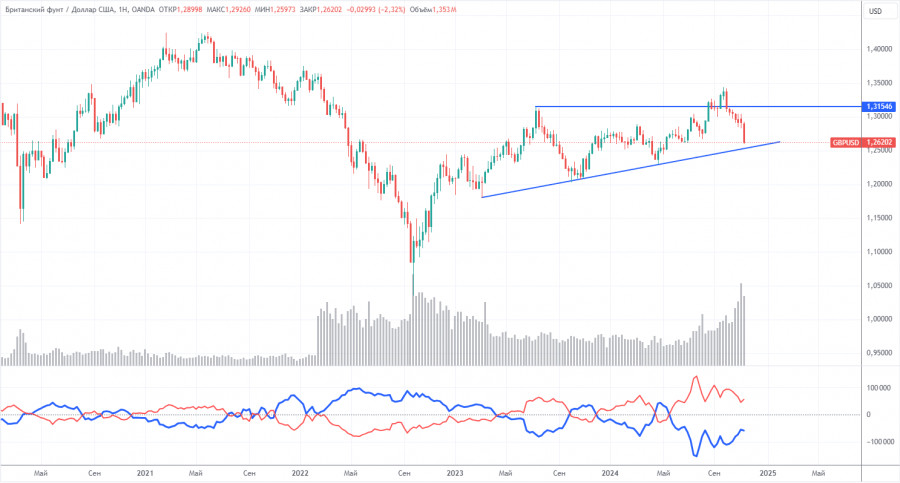
The COT reports on the British pound show that commercial traders' sentiment has been highly volatile in recent years. The red and blue lines representing the net positions of commercial and non-commercial traders frequently intersect and usually hover near the zero mark. The most recent downward trend coincided with the red line being below zero. Currently, the red line is above zero.

According to the latest COT report, the non-commercial group closed 700 BUY contracts and 11,700 SELL contracts. As a result, the net position of non-commercial traders grew by 11,000 contracts over the week. While the market is not rushing to sell the pound sterling in the medium term, the movements of the past six weeks are encouraging.

The fundamental backdrop still provides no basis for long-term pound purchases, and the pound has a realistic chance of resuming its global downtrend. However, on the weekly timeframe, there is an upward trendline. Until this trendline is broken, long-term expectations of a decline in the pound remain speculative. For now, the pound continues to demonstrate significant resilience against the dollar.

GBP/USD 1-Hour Analysis

This image is no longer relevant

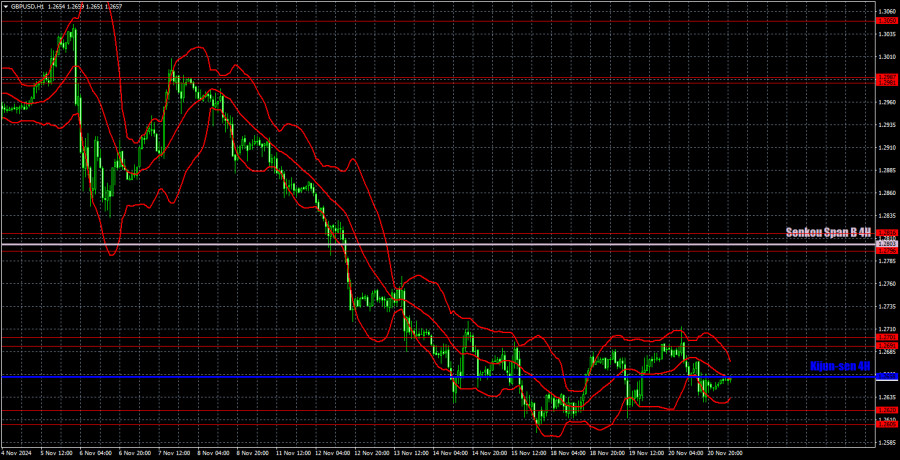
The GBP/USD pair maintains a downward bias on the hourly timeframe. The previous upward trend has been invalidated, leaving further declines in the British currency as the most likely scenario, particularly sharp and prolonged ones. The recent correction turned into a flat range and has already ended. A new correction has started, supported by the 1.2605–1.2620 area, but it still looks more like a flat. There are no fundamental reasons to expect a significant rally in the pound sterling, and the inflation report failed to provide any meaningful support.

For November 21, we highlight the following important levels: 1.2429-1.2445, 1.2516, 1.2605-1.2620, 1.2796-1.2816, 1.2863, 1.2981-1.2987, 1.3050. Senkou Span B (1.2803) and Kijun-sen (1.2658) lines can also be sources of signals. Ichimoku indicator lines may shift throughout the day and should be monitored when generating signals. Place Stop Loss orders at breakeven once the price moves 20 pips in the desired direction to protect against potential losses from false signals.

Thursday's economic calendar in the UK and the US is light, with only a few minor reports expected. It is unlikely to happen today because Wednesday's much more significant data failed to break the horizontal channel. The pair is likely to remain within the same range.

Chart Explanations:

Support and resistance levels: thick red lines around which movement may end. They are not sources of trading signals.

Kijun-sen and Senkou Span B lines: Ichimoku indicator lines transferred from the 4-hour to the 1-hour timeframe. These are strong lines.

Extreme levels: thin red lines where the price previously rebounded. They are sources of trading signals.

Yellow lines: Trend lines, trend channels, and other technical patterns.

Indicator 1 on COT charts: The net position size for each category of traders.

Paolo Greco,
Analytical expert of InstaForex
© 2007-2025
Select timeframe
5
min
15
min
30
min
1
hour
4
hours
1
day
1
week
Earn on cryptocurrency rate changes with InstaForex
Download MetaTrader 4 and open your first trade
  • Grand Choice
    Contest by
    InstaForex
    InstaForex always strives to help you
    fulfill your biggest dreams.
    JOIN CONTEST

Recommended Stories

GBP/USD: Trading Plan for the U.S. Session on February 3rd (Review of Morning Trades)

In my morning forecast, I highlighted the 1.2301 level as a key point for making market entry decisions. Let's review the 5-minute chart to see what happened. Although there

Miroslaw Bawulski 12:35 2025-02-03 UTC+2

EUR/USD: Trading Plan for the U.S. Session on February 3rd (Review of Morning Trades). The Euro Manages to Stay Above 1.0216

In my morning forecast, I highlighted the 1.0214 level as a key decision point for market entries. Let's take a look at the 5-minute chart to see what happened

Miroslaw Bawulski 12:26 2025-02-03 UTC+2

Trading Recommendations and Analysis for EUR/USD on February 3. The Euro Heads Downward Under News Pressure

The EUR/USD currency pair experienced a moderate decline on Friday. As mentioned previously, the euro could have lost significantly more value over the past week; however, the market largely overlooked

Paolo Greco 02:46 2025-02-03 UTC+2

Trading Recommendations and Analysis for GBP/USD on February 3. The Pound Continues to Toy with Traders

The GBP/USD currency pair has continued to trade erratically, exhibiting sideways movement for the third or even fourth consecutive day. On the hourly timeframe, it's evident that the price action

Paolo Greco 02:46 2025-02-03 UTC+2

How to Trade the GBP/USD Pair on February 3? Simple Tips and Trade Analysis for Beginners

Analysis of Friday's Trades 1H Chart of GBP/USD On Friday, the GBP/USD pair showed a tendency to decline but failed to break below the 1.2387 level once again. The British

Paolo Greco 23:15 2025-02-02 UTC+2

How to Trade the EUR/USD Pair on February 3? Simple Tips and Trade Analysis for Beginners

Analysis of Friday's Trades 1H Chart of EUR/USD On Friday, the EUR/USD currency pair continued its downward trend after consolidating below the ascending trendline. Although this downward movement is warranted

Paolo Greco 23:15 2025-02-02 UTC+2

GBP/USD: Trading Plan for the U.S. Session on January 31st (Review of Morning Trades)

In my morning forecast, I highlighted the 1.2427 level as a key point for making market entry decisions. Let's analyze the 5-minute chart to see what happened. GBP/USD tested 1.2427

Miroslaw Bawulski 13:08 2025-01-31 UTC+2

EUR/USD: Trading Plan for the U.S. Session on January 31st (Review of Morning Trades)

In my morning forecast, I highlighted the 1.0377 level as a key reference point for making entry decisions. Let's analyze the 5-minute chart to see what happened. While the price

Miroslaw Bawulski 13:04 2025-01-31 UTC+2

How to Trade the GBP/USD Pair on January 31? Simple Tips and Trade Analysis for Beginners

Analysis of Thursday's Trades 1H Chart of GBP/USD The GBP/USD pair continued to trade sideways on Thursday. There was significantly less news regarding the British currency compared to the euro

Paolo Greco 07:12 2025-01-31 UTC+2

How to Trade the EUR/USD Pair on January 31? Simple Tips and Trade Analysis for Beginners

Analysis of Thursday's Trades 1H Chart of EUR/USD The EUR/USD currency pair displayed erratic movements on Thursday. It seems the market received some information but was uncertain about its implications

Paolo Greco 07:12 2025-01-31 UTC+2
Can't speak right now?
Ask your question in the chat.
Widget callback
 

Dear visitor,

Your IP address shows that you are currently located in the USA. If you are a resident of the United States, you are prohibited from using the services of InstaFintech Group including online trading, online transfers, deposit/withdrawal of funds, etc.

If you think you are seeing this message by mistake and your location is not the US, kindly proceed to the website. Otherwise, you must leave the website in order to comply with government restrictions.

Why does your IP address show your location as the USA?

  • - you are using a VPN provided by a hosting company based in the United States;
  • - your IP does not have proper WHOIS records;
  • - an error occurred in the WHOIS geolocation database.

Please confirm whether you are a US resident or not by clicking the relevant button below. If you choose the wrong option, being a US resident, you will not be able to open an account with InstaForex anyway.

We are sorry for any inconvenience caused by this message.