Everything becomes clear in comparison...
In this regard, we look at yesterday's options for #USDX vs EUR / USD H4 vs GBP / USD H4 and relate them to the current situation on FOREX today, and then try to determine the prospects for the development of these instruments from July 17, 2019.
Minuette (H4)
____________________
US dollar Index
After the breakdown of the resistance level of 96.95 (the final Schiff Line Minuette) #USDX was in the range again :
- resistance level of 97.38 (lower boundary of the ISL38.2 equilibrium zone of the Minuette operating scale fork);
- support level of 97.22 (a Median Line channel Minuette);
The direction of the breakdown of which will determine the development trend of the movement of the dollar index from July 17, 2019.
The breakdown of the resistance level of 97.38 - the development of the #USDX movement will continue in the equilibrium zone (97.38 - 97.50 - 97.70) of the Minuette operating scale with a perspective (after the breakdown of ISL61.8 Minuette - the resistance level of 97.70) to reach the final Shiff Line Minuette (97.95) and the final FSL line Minuette (98.22).
When the dollar index returns below the 1/2 Median Line channel Minuette (support level of 97.22), the development of the #USDX movement can be continued towards the goals - the lower boundary of the ISL38.2 (96.90) equilibrium zone of the Minuette operational scale fork - local minimum 96.75 - 1/2 Median Line channel Minuette (96.25 - 96.05 - 95.85).
The details of the #USDX movement from July 17, 2019 are presented in the animated graphic.
____________________
Euro vs US Dollar
The 1/2 Median Line channel of the Minuette operational scale (support level of 1.1255) could not stop the downward movement of the single European currency, and EUR / USD was in the range formed by the levels:
- resistance level of 1.1235 (SSL start line for the Minuette operating scale);
- support level of 1.1220 (lower boundary of ISL61.8 equilibrium zone of the Minuette operational scale fork);
Accordingly, the further development of the EUR / USD movement from July 17, 2019 will be due to the direction of the breakdown of this range.
The breakdown of the support level of 1.1220 at the lower boundary of the ISL61.8 equilibrium zone of the Minuette operational scale fork , together with the breakdown of the support level of 1.1210, will determine the further development of the movement of EUR / USD in the channel boundaries of the 1/2 Median Line (1.1210 - 1.1195 - 1.1175) and equilibrium zone (1.1185 - 1.1165 - 1.1150) of the Minuette operational scale fork with the prospect of reaching the ultimate Schiff Line Minuette (1.1130).
On the other hand, if the EUR / USD returns above the initial SSL line (resistance level of 1.1235) of the Minuette operating scale fork, then there may be a development of the upward movement of the single European currency to the targets - the 1/2 Median Line channel of the Minuette (1.1255) - the upper boundary of the ISL38.2 (1.1290) the equilibrium zone of the Minuette operational scale fork with the prospect of reaching the lower boundary of the channel of the 1/2 Median Line Minuette (1.1340).
The details of the EUR / USD movement options from July 17, 2019 are shown in the animated graphic.
____________________
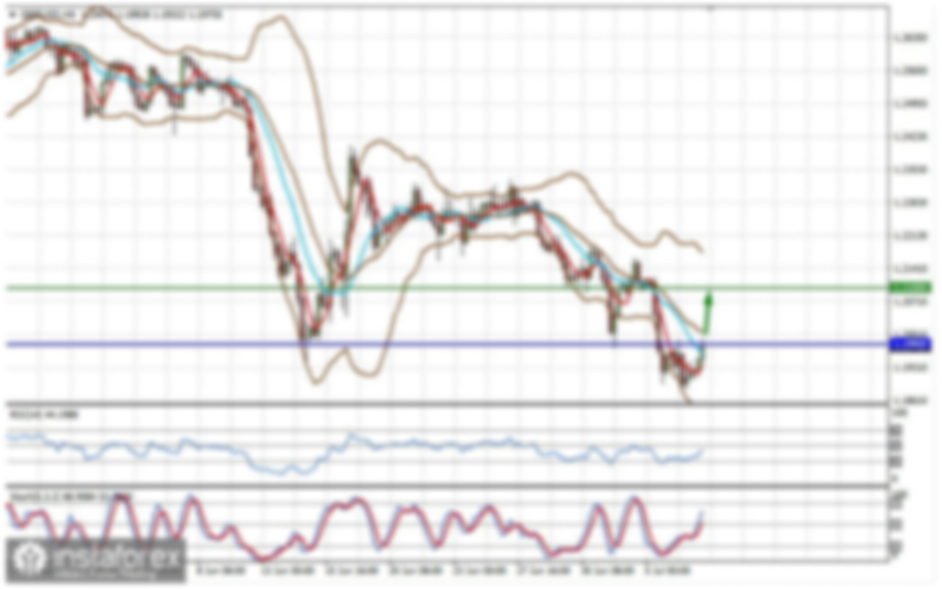
Great Britain Pound vs US Dollar
1/2 Median Line Minuette (support level of 1.2510) was safely broken. As a result of which, Her Majesty's currency (GBP) found itself in an equilibrium zone (1.2460 - 1.2415 - 1.2375) of the Minuette operating scale. The breakdown direction of which will determine the further development of the GBP / USD movement from July 17, 2019.
The breakdown of the lower boundary of ISL61.8 (support level of 1.2375) of the Minuette operational scale fork along with the LWL38.2 Minuette warning line (1.2385) will make it possible to continue the downward movement of GBP / USD to the control line LTL Minuette (1.2315) and the warning line LWL61. 8 Minuette (1.2287).
In the case of the breakdown of the upper boundary of ISL38.2 (resistance level of 1.2460) of the Minuette operational scale, the development of Her Majesty's currency movement will continue to the 1/2 Median Line Minuette channel (1.2460 - 1.2500 - 1.2540) with the prospect of reaching the initial line SSL Minuette (1.2580) and the lower boundary of the 1/2 Median Line channel Minuette (1.2645).
The details of the GBP / USD movement from July 17, 2019 are presented in the animated graphic.
____________________
The review was compiled without taking into account of the news background. The opening of trading sessions of the main financial centers does not serve as a guide to action (placing orders "sell" or "buy").
The formula for calculating the dollar index :
USDX = 50.14348112 * USDEUR0.576 * USDJPY0.136 * USDGBP0.119 * USDCAD0.091 * USDSEK0.042 * USDCHF0.036.
where power ratios correspond to the weights of currencies in the basket:
Euro - 57.6% ;
Yen - 13.6%;
Pound sterling - 11.9% ;
Canadian dollar - 9.1%;
Swedish krona - 4.2%;
Swiss franc - 3.6%.
The first coefficient in the formula gives the index value to 100 on the starting date - March 1973, when the main currencies began to be freely quoted relative to each other.