empty
 
 
13.11.2024 03:42 AM
Overview of EUR/USD on November 13; The Euro's Collapse Continues

This image is no longer relevant

The EUR/USD currency pair continued its decline throughout most of Tuesday. At this point, it's almost redundant to state the obvious: the euro keeps falling due to the factors we've outlined since the start of the year. We still believe the primary reason for the euro's decline is the market's complete or near-complete pricing of the Federal Reserve's monetary policy easing. Let's try to predict where the euro might end up.

To answer that, let's examine the weekly timeframe. In September 2022, the dollar's decline began after a 15–16-month period of relentless growth, during which it gained around 26 cents. However, as U.S. inflation decreased, the market started anticipating monetary policy easing from the Fed, triggering the dollar's prolonged decline. In our view, this decline is merely a correction within a global downtrend. Of course, every trend eventually ends, but such a reversal requires significant, fundamental, and long-term reasons, none of which are currently present.

Given these observations, the euro could return to the $0.95 level. However, since this is an extreme target, and the trend will end sooner or later, we've maintained a more achievable range of $1.00–$1.02 as our objective since the start of the year. A few conclusions can be drawn since the euro has fallen 600 pips in just 1.5 months.

The market is now bullish on the dollar. The second is that the market has fully priced in all the reasons to sell the dollar and is ready to buy it even without fresh local news and reports. The third is that for the "dollar trend" to end, a significant and catastrophic event would need to occur in the U.S., which currently seems unlikely. Factors such as Donald Trump's return to power, the Fed's potential pause in December, the robust U.S. economy, and a relatively stable labor market all favor the dollar's strength. In his most recent remarks, even Jerome Powell did not highlight the need to continue easing monetary policy to "save the labor market." Thus, it appears the U.S. labor market doesn't need saving.

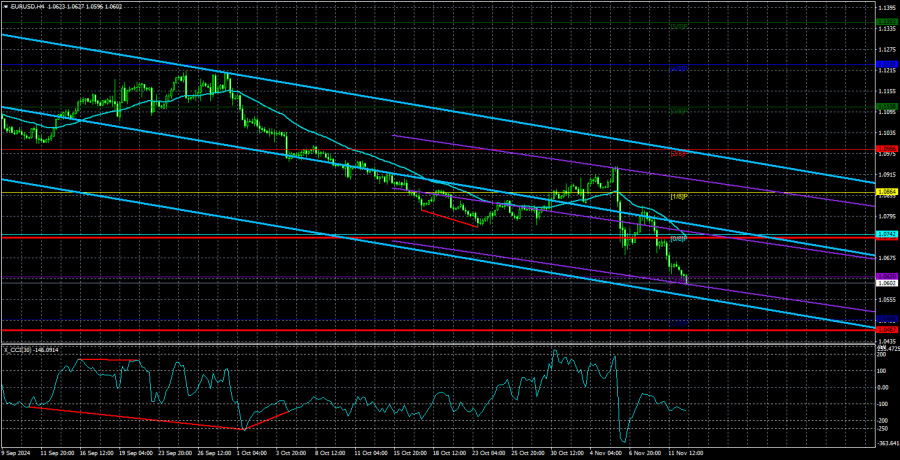
On the 4-hour timeframe, the pair occasionally pauses its decline. However, such pauses may start around the 6th level. The CCI indicator recently dipped into the oversold area and could now form a "bullish divergence." This should provide enough momentum for a slight upward correction.

This image is no longer relevant

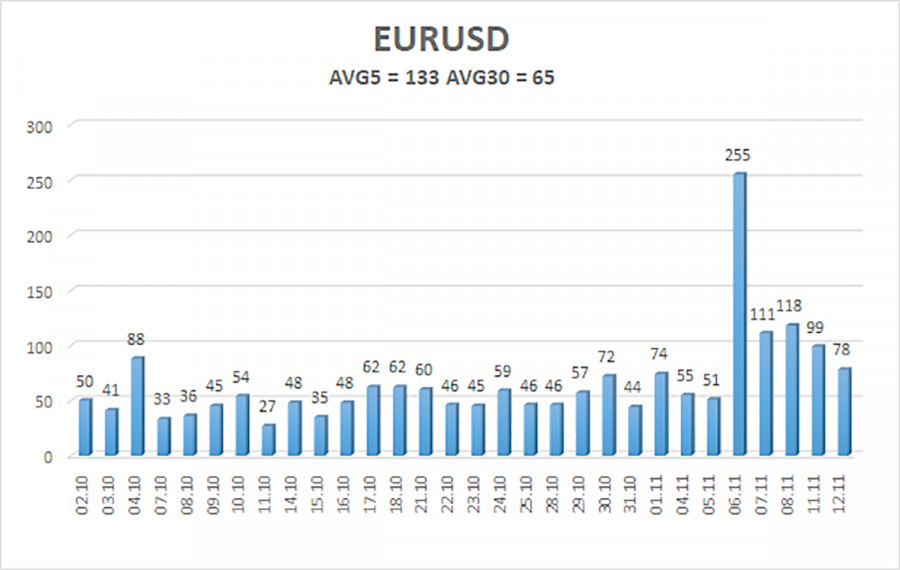
As of November 13, the average volatility for the EUR/USD pair over the last five trading days is 133 pips, categorized as "high." We expect the pair to trade between 1.0467 and 1.0733 on Wednesday. The higher linear regression channel points downward, reinforcing the global downtrend. While briefly signaling oversold conditions, the CCI indicator has already completed its weak corrective phase.

Nearest Support Levels:

S1: 1.0498

S2: 1.0467

Nearest Resistance Levels:

R1: 1.0620

R2: 1.0742

R3: 1.0864

Trading Recommendations:

The EUR/USD pair continues its downward trajectory. For weeks, we've forecasted only declines in the euro in the medium term, and we maintain our bearish outlook. There's a possibility that the market has priced in all or nearly all potential rate cuts by the Fed. If so, there are no compelling reasons for the dollar to fall—if there ever were. Short Positions can still be considered with targets at 1.0498 and 1.0467 if the price remains below the moving average. If you are trading on pure technicals, Long Positions may be considered only if the price moves above the moving average, with targets at 1.0864 and 1.0986, but we currently advise against long positions given the market environment.

Explanation of Illustrations:

Linear Regression Channels help determine the current trend. If both channels are aligned, it indicates a strong trend.

Moving Average Line (settings: 20,0, smoothed) defines the short-term trend and guides the trading direction.

Murray Levels act as target levels for movements and corrections.

Volatility Levels (red lines) represent the likely price range for the pair over the next 24 hours based on current volatility readings.

CCI Indicator: If it enters the oversold region (below -250) or overbought region (above +250), it signals an impending trend reversal in the opposite direction.

Paolo Greco,
Analytical expert of InstaForex
© 2007-2025
Earn on cryptocurrency rate changes with InstaForex
Download MetaTrader 4 and open your first trade
  • Grand Choice
    Contest by
    InstaForex
    InstaForex always strives to help you
    fulfill your biggest dreams.
    JOIN CONTEST
  • Chancy Deposit
    Deposit your account with $3,000 and get $10000 more!
    In January we raffle $10000 within the Chancy Deposit campaign!
    Get a chance to win by depositing $3,000 to a trading account. Having fulfilled this condition, you become a campaign participant.
    JOIN CONTEST
  • Trade Wise, Win Device
    Top up your account with at least $500, sign up for the contest, and get a chance to win mobile devices.
    JOIN CONTEST
  • 100% Bonus
    Your unique opportunity to get a 100% bonus on your deposit
    GET BONUS
  • 55% Bonus
    Apply for a 55% bonus on your every deposit
    GET BONUS
  • 30% Bonus
    Receive a 30% bonus every time you top up your account
    GET BONUS

Recommended Stories

Can't speak right now?
Ask your question in the chat.
Widget callback