empty
 
 
13.11.2024 09:55 AM
EUR/USD and GBP/USD on November 13 – Technical Analysis

EUR/USD

This image is no longer relevant

Higher Timeframes

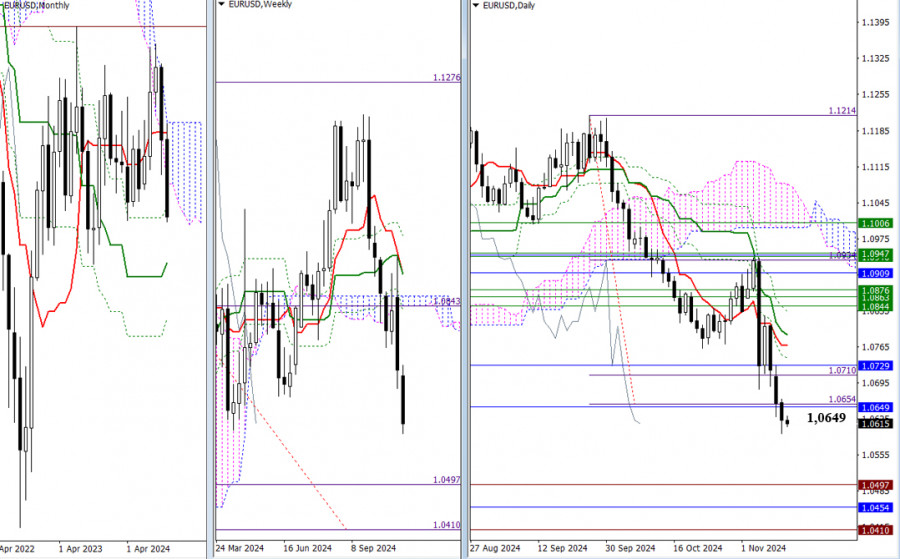
Yesterday, the bears updated the previous day's low and continued their decline. At this stage, the pair strives to overcome the influence and pull of the monthly supports (1.0649 – 1.0729) and the daily Ichimoku breakout targets (1.0654 – 1.0710). If the bears succeed, they will head towards the monthly medium-term trend (1.0454) and the weekly Ichimoku breakout targets (1.0410 – 1.0497). If the bears fail, the market will likely return to the cluster of levels (1.0649–1.0729), where consolidation is expected to continue.

This image is no longer relevant

H4 – H1

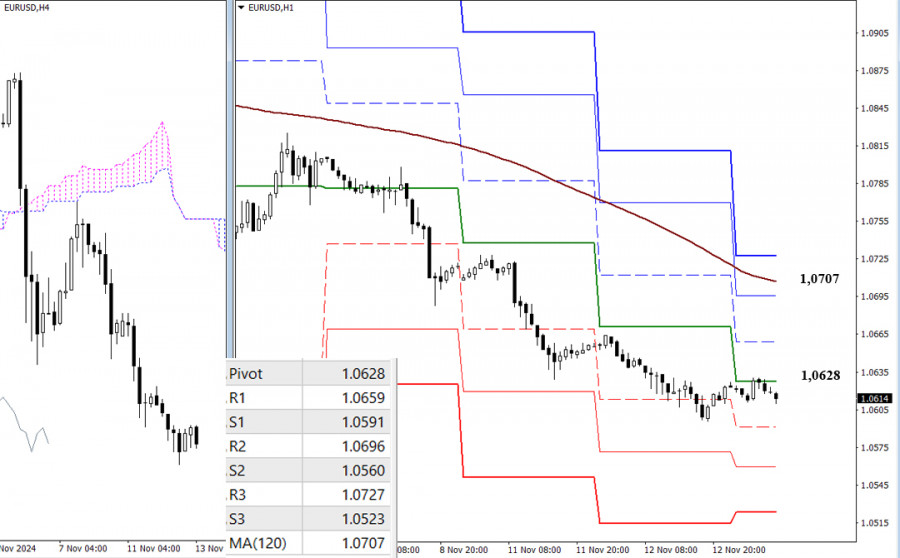
The bears maintain their advantage on lower timeframes and continue to develop a downward trend. Intraday targets for further decline are the supports of the classic Pivot levels, currently located at 1.0591, 1.0560, and 1.0523. We see slight hesitation at the moment, with the pair being influenced by the central Pivot level of the day (1.0628). A consolidation above this level could lead to a corrective rise, with the main target being the resistance of the weekly long-term trend (1.0707). A breakout and reversal of the trend could shift the current balance of power. Additional resistance levels along the way are R1 (1.0659) and R2 (1.0696).


GBP/USD

This image is no longer relevant

Higher Timeframes

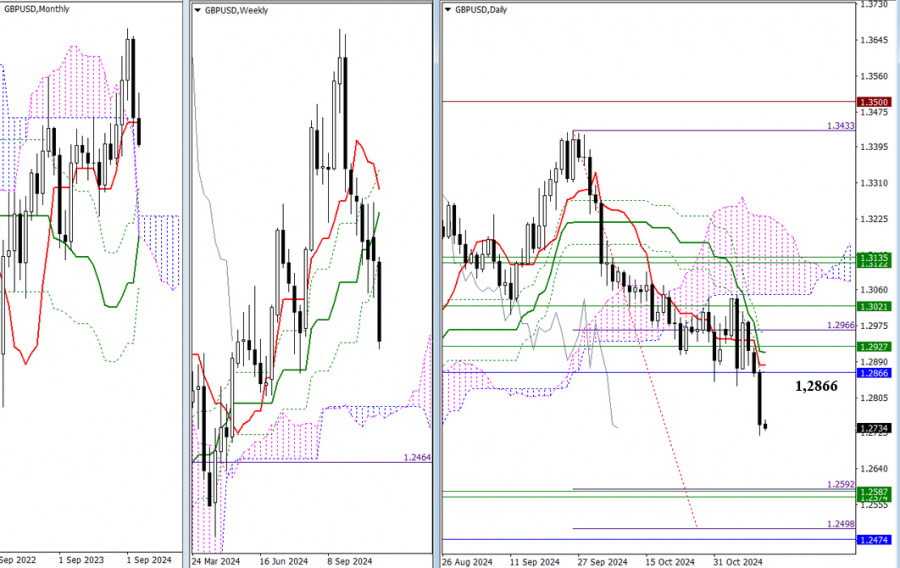
Yesterday, the bears finally overcame the pull of the monthly short-term trend (1.2866) and achieved a meaningful decline. The monthly short-term trend now serves as the nearest resistance. A return to this level, especially a consolidation above it, could halt the current decline phase. The next downside targets are the weekly Ichimoku cloud (1.2587–1.2574), the daily target (1.2592 – 1.2498), and the monthly support (1.2474).

This image is no longer relevant

H4 – H1

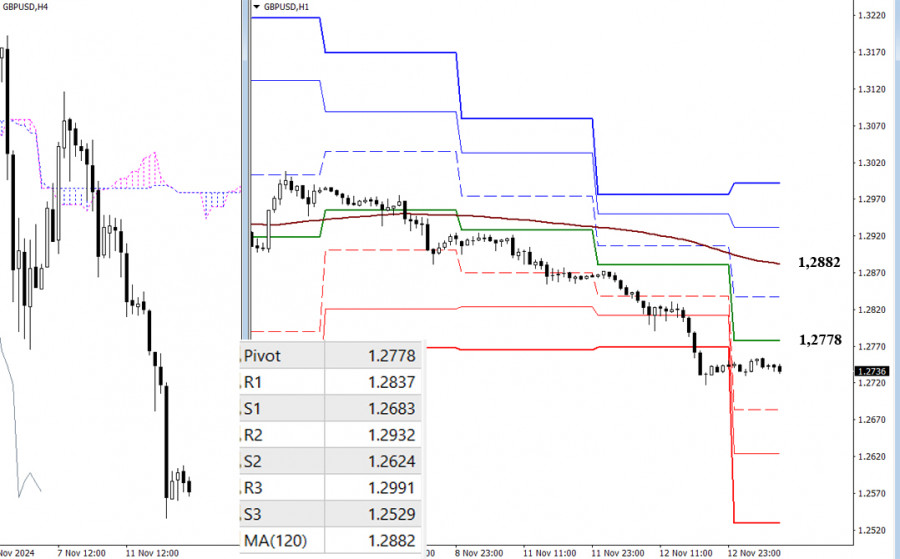
The bears hold the primary advantage on lower timeframes as they develop a downward trend. The intraday targets for the bears are the supports of the classic Pivot levels at 1.2683, 1.2624, and 1.2529. If the current pause develops further, a corrective rise may aim to reach the key levels of the lower timeframes at 1.2778 (the central Pivot level of the day) and 1.2882 (the weekly long-term trend). Additional resistance could come from R1 (1.2837). Consolidation above the trend and its reversal would allow the balance of power to shift. Further resistance levels in case of continued upward movement are R2 (1.2932) and R3 (1.2991).


Technical Analysis Tools Used:

  • Higher Timeframes: Ichimoku Kinko Hyo (9.26.52) + Fibonacci Kijun levels.
  • Lower Timeframes: H1 – Pivot Points (classic) + 120 Moving Average (weekly long-term trend).
Evangelos Poulakis,
Analytical expert of InstaForex
© 2007-2025
Earn on cryptocurrency rate changes with InstaForex
Download MetaTrader 4 and open your first trade
  • Grand Choice
    Contest by
    InstaForex
    InstaForex always strives to help you
    fulfill your biggest dreams.
    JOIN CONTEST
  • Chancy Deposit
    Deposit your account with $3,000 and get $10000 more!
    In January we raffle $10000 within the Chancy Deposit campaign!
    Get a chance to win by depositing $3,000 to a trading account. Having fulfilled this condition, you become a campaign participant.
    JOIN CONTEST
  • Trade Wise, Win Device
    Top up your account with at least $500, sign up for the contest, and get a chance to win mobile devices.
    JOIN CONTEST
  • 100% Bonus
    Your unique opportunity to get a 100% bonus on your deposit
    GET BONUS
  • 55% Bonus
    Apply for a 55% bonus on your every deposit
    GET BONUS
  • 30% Bonus
    Receive a 30% bonus every time you top up your account
    GET BONUS

Recommended Stories

Can't speak right now?
Ask your question in the chat.
Widget callback