empty
30.01.2025 03:31 PM
GBP/USD: Trading Plan for the U.S. Session on January 30 (Review of Morning Trades)

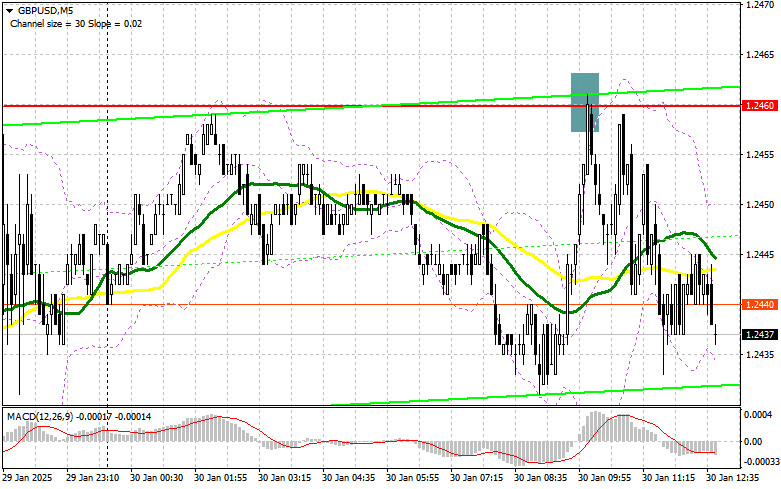
In my morning forecast, I emphasized 1.2460 as a key level for market entries. Looking at the 5-minute chart, the false breakout at 1.2460 provided an excellent selling opportunity, leading to a drop of over 30 points. The technical outlook for the second half of the day remains unchanged.

This image is no longer relevant

Buying Strategy for GBP/USD

Despite decent lending data from the UK, the pound attempted to break above 1.2460 in the first half of the day but failed to gain support from major players, quickly returning to its sideways range. In the second half of the day, traders will shift focus to the U.S. Q4 GDP growth figures and Initial Jobless Claims

A significant slowdown in U.S. economic growth at the end of last year could be problematic for economists and the Federal Reserve, which kept rates unchanged yesterday. Such a scenario would pressure the dollar and potentially trigger stronger demand for the British pound. However, strong U.S. economic data could increase bearish pressure on GBP/USD.

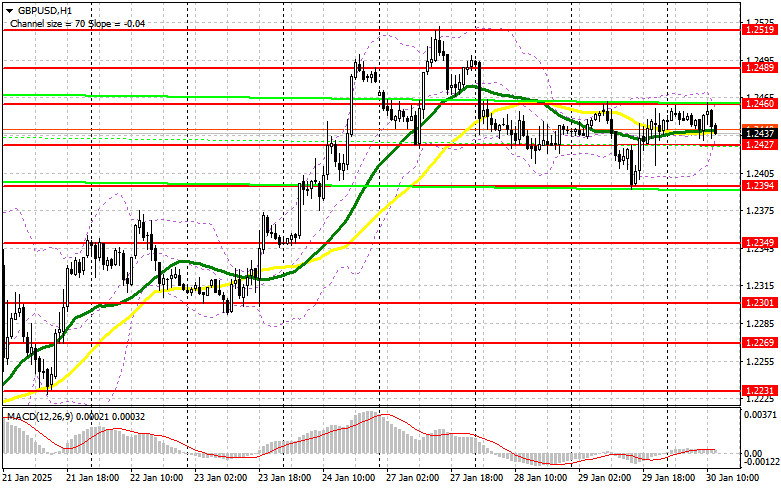
If GBP/USD declines, I will consider buying only after a false breakout around the 1.2427 support level, expecting a new rise toward 1.2460. This level is expected to attract sellers again. A break and retest of 1.2460 from above would confirm bullish continuation, opening the door for a move to 1.2489, reinforcing the bullish trend. The final target will be 1.2519, where I will take profits.

If GBP/USD drops further and fails to find buyers at 1.2427, bearish momentum could accelerate. In this case, I will wait for a false breakout at 1.2394 before considering long positions. If the decline extends, I will consider buying at 1.2349 for a 30-35 point intraday correction.

Selling Strategy for GBP/USD

Sellers are attempting to regain control, but they need strong U.S. data to push the pair lower. If GBP/USD rises again, I will sell from the 1.2460 resistance level, following the same strategy as in the morning. A false breakout at 1.2460, combined with strong U.S. data, would create a selling opportunity, targeting 1.2427. A break and retest of 1.2427 from below would clear stop-loss orders and open the way to 1.2394. The final bearish target will be 1.2349, where I will take profits.

If GBP/USD rallies and sellers fail to defend 1.2460, the bullish trend could resume. In that case, I will wait for a test of 1.2489 before considering short positions. A false breakout at 1.2489 would provide a short entry. If the pair continues higher, I will look for sell opportunities at 1.2519, aiming for a 30-35 point downside correction.

This image is no longer relevant

COT Report (Commitments of Traders – January 21)

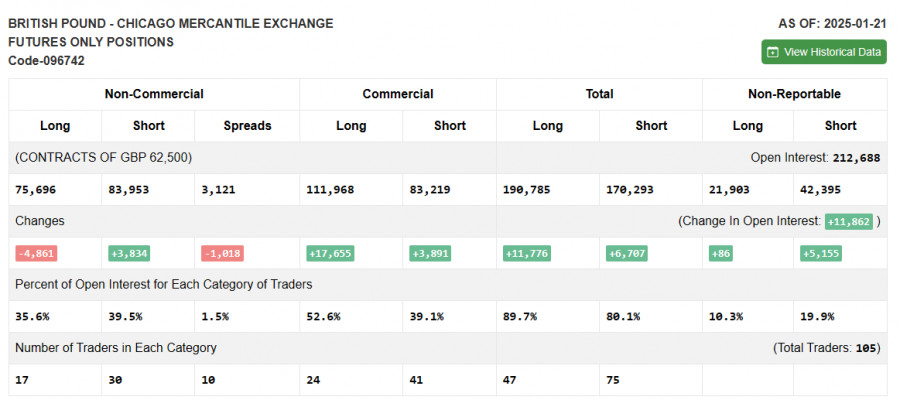
The latest COT data shows that short positions increased, while long positions declined, shifting the market bias further in favor of sellers. UK economic data remains weak, while inflation has resumed its upward trend, putting the Bank of England in a tough spot. The BoE is likely to cut rates at its next meeting, a factor already reflected in GBP pricing. However, the pound's short-term movement depends on Trump's policies and the strength of the U.S. dollar.

Key COT data:

  • Long non-commercial positions declined by 4,861, to 75,696.
  • Short non-commercial positions increased by 3,834, to 83,953.
  • The net short position expanded by 1,018.

This image is no longer relevant

Indicator Signals for GBP/USD

Moving Averages:

The pair is trading near the 30-day and 50-day moving averages, indicating market uncertainty.

Bollinger Bands:

If GBP/USD declines, the lower Bollinger Band around 1.2427 will act as support.

Indicator Descriptions

Moving Averages:

  • 50-period Moving Average – Identifies the current trend by smoothing volatility and noise. (Displayed in yellow on the chart.)
  • 30-period Moving Average – Provides additional confirmation of the trend direction. (Displayed in green on the chart.)

MACD (Moving Average Convergence/Divergence):

  • Fast EMA: 12-period.
  • Slow EMA: 26-period.
  • SMA: 9-period.

Bollinger Bands:

  • Period: 20.
  • Used to identify volatility levels and potential reversal points.

Commitments of Traders (COT) Report:

  • Non-commercial traders – Speculative participants, including retail traders, hedge funds, and large institutions, who use the futures market for speculative purposes and meet specific criteria.
  • Long non-commercial positions – Represent the total open long positions held by speculative traders.
  • Short non-commercial positions – Represent the total open short positions held by speculative traders.
  • Net non-commercial position – The difference between short and long positions among speculative traders.
Miroslaw Bawulski,
Analytical expert of InstaForex
© 2007-2025
GBPUSD
Great Britain Pound vs US Dollar
Summary
Sell
Urgency
1 day
Analytic
Maxim Magdalinin
Start trade
Earn on cryptocurrency rate changes with InstaForex
Download MetaTrader 4 and open your first trade
  • Grand Choice
    Contest by
    InstaForex
    InstaForex always strives to help you
    fulfill your biggest dreams.
    JOIN CONTEST

Recommended Stories

GBP/USD: Trading Plan for the U.S. Session on February 28th (Analysis of Morning Trades)

In my morning forecast, I focused on the 1.2607 level as a key decision point for entering the market. Looking at the 5-minute chart, the price moved higher but fell

Miroslaw Bawulski 11:50 2025-02-28 UTC+2

EUR/USD: Trading Plan for the U.S. Session on February 28th (Analysis of Morning Trades)

In my morning forecast, I focused on the 1.0404 level as a key decision point for entering the market. Looking at the 5-minute chart, we see that the price rise

Miroslaw Bawulski 11:46 2025-02-28 UTC+2

How to Trade the GBP/USD Pair on February 28? Simple Tips and Trade Analysis for Beginners

Analysis of Thursday's Trades 1H Chart of GBP/USD The GBP/USD pair declined on Thursday, despite having fewer reasons for this movement. Trump's tariffs against the EU do not directly affect

Paolo Greco 06:30 2025-02-28 UTC+2

How to Trade the EUR/USD Pair on February 28? Simple Tips and Trade Analysis for Beginners

Analysis of Thursday's Trades 1H Chart of EUR/USD On Thursday, the EUR/USD currency pair initially consolidated below the ascending trendline before starting to decline, as anticipated. Several factors contributed

Paolo Greco 06:30 2025-02-28 UTC+2

Trading Recommendations and Analysis for GBP/USD on February 28: The Pound is Also Preparing to Decline

The GBP/USD pair also declined on Thursday, although its volatility was lower than that of the EUR/USD, resulting in a more modest drop. The price struggled initially but eventually broke

Paolo Greco 02:49 2025-02-28 UTC+2

Trading Recommendations and Analysis for EUR/USD on February 28: The Euro Waited for the Right Moment and Plunged

The EUR/USD currency pair experienced a significant drop on Thursday. For over a week, the price had been hovering near the upper boundary of a sideways channel on the daily

Paolo Greco 02:49 2025-02-28 UTC+2

GBP/USD: Trading Plan for the US Session on February 27th (Review of Morning Trades)

In my morning forecast, I highlighted the 1.2680 level as a key reference point for entering the market. Looking at the 5-minute chart, the upward movement occurred, but the price

Miroslaw Bawulski 15:11 2025-02-27 UTC+2

EUR/USD: Trading Plan for the U.S. Session on February 27th (Review of Morning Trades)

In my morning forecast, I highlighted the 1.0491 level as a key area for market entry decisions. A review of the 5-minute chart shows that although there was an upward

Miroslaw Bawulski 14:50 2025-02-27 UTC+2

How to Trade the GBP/USD Pair on February 27? Simple Tips and Trade Analysis for Beginners

Analysis of Wednesday's Trades 1H Chart of GBP/USD On Wednesday, GBP/USD attempted to continue its upward movement, but this trend is starting to look questionable. Previously, we noted that

Paolo Greco 06:32 2025-02-27 UTC+2

How to Trade the EUR/USD Pair on February 27? Simple Tips and Trade Analysis for Beginners

Analysis of Wednesday's Trades 1H Chart of EUR/USD The EUR/USD currency pair traded flat on Wednesday, breaking the ascending trend line. However, it is important to note that a trendline

Paolo Greco 06:32 2025-02-27 UTC+2
Can't speak right now?
Ask your question in the chat.
Widget callback
 

Dear visitor,

Your IP address shows that you are currently located in the USA. If you are a resident of the United States, you are prohibited from using the services of InstaFintech Group including online trading, online transfers, deposit/withdrawal of funds, etc.

If you think you are seeing this message by mistake and your location is not the US, kindly proceed to the website. Otherwise, you must leave the website in order to comply with government restrictions.

Why does your IP address show your location as the USA?

  • - you are using a VPN provided by a hosting company based in the United States;
  • - your IP does not have proper WHOIS records;
  • - an error occurred in the WHOIS geolocation database.

Please confirm whether you are a US resident or not by clicking the relevant button below. If you choose the wrong option, being a US resident, you will not be able to open an account with InstaForex anyway.

We are sorry for any inconvenience caused by this message.