empty
12.02.2025 11:43 AM
EUR/USD – February 12th: Powell Confirms FOMC's Hawkish Stance

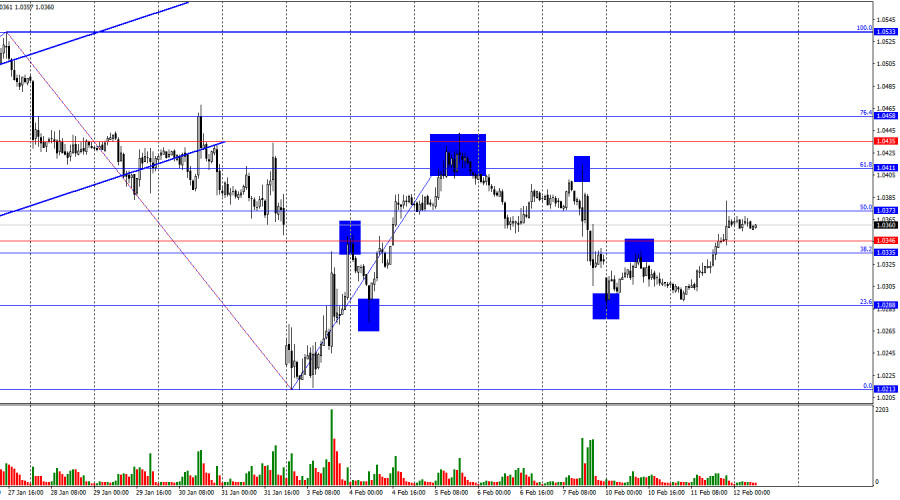
On Tuesday, EUR/USD reversed in favor of the euro around the 23.6% Fibonacci retracement level at 1.0288 and began a new upward movement. Bulls managed to push the pair to the 50.0% Fibonacci level at 1.0373. A rejection from this level would support the U.S. dollar and pull the pair back toward 1.0288. However, if EUR/USD consolidates above 1.0373, the uptrend may extend toward 1.0411 and 1.0435.

This image is no longer relevant

On the hourly chart, the last completed downward wave broke below the previous low, while the last completed upward wave failed to break the previous high. This suggests either a bearish trend shift or a complex sideways movement. Wave sizes have been inconsistent, raising doubts about the presence of a clear trend.

Tuesday's fundamental background was relatively dull. Traders anticipated Jerome Powell's testimony before Congress, but they were more interested in new insights rather than the speech itself. Many expected senators to ask Powell about Donald Trump's influence on Fed policy, but that question never came up.

Powell himself reaffirmed the Fed's hawkish stance on monetary policy. No rush to cut interest rates as economic growth remains strong and inflation remains elevated. The Fed plans to keep rates at current levels for most of 2025. Despite the hawkish tone, bearish traders found nothing new in Powell's remarks. Since similar comments have been made multiple times, the market largely ignored them.

This image is no longer relevant

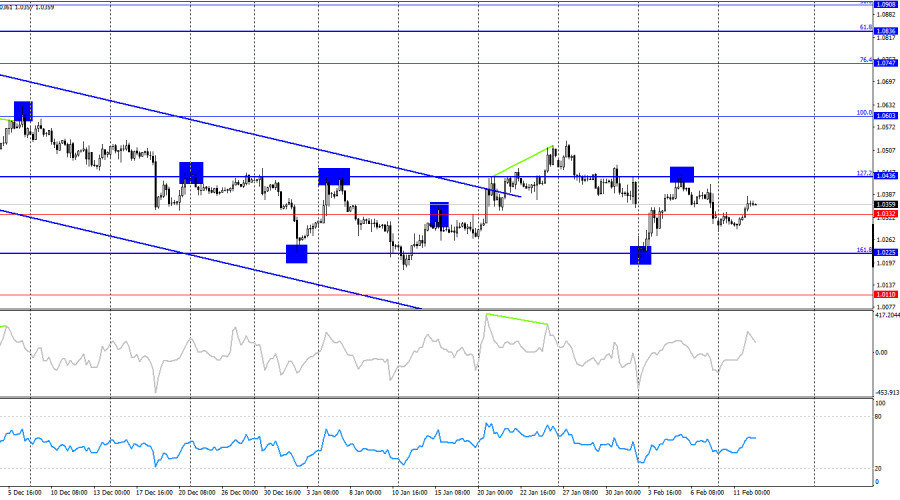
On the 4-hour chart, the pair rebounded from the 127.2% Fibonacci retracement level at 1.0436, leading to a reversal in favor of the U.S. dollar. EUR/USD now has a realistic chance of returning to the 161.8% Fibonacci level at 1.0225. For bulls to break above 1.0436 and sustain further growth, a strong fundamental catalyst would be required. The CCI indicator is forming a bearish divergence, signaling potential downside pressure.

Commitments of Traders (COT) Report

This image is no longer relevant

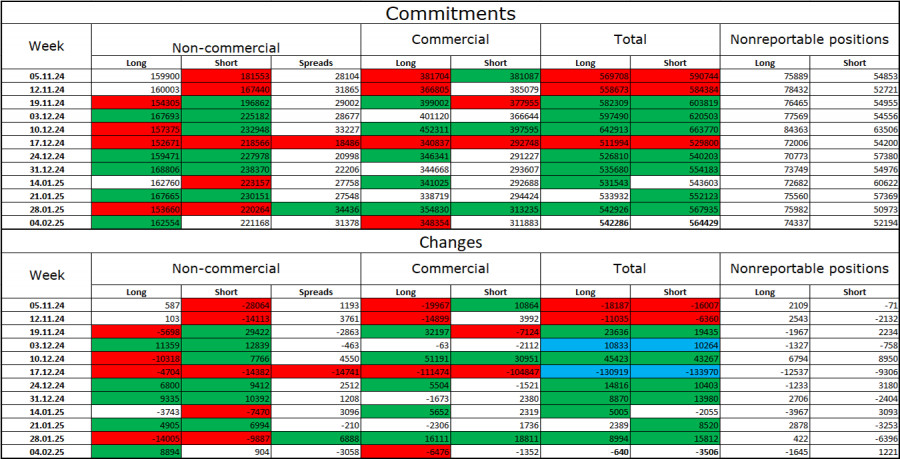
In the last reporting week, institutional traders opened 8,894 long positions and 904 short positions. The "Non-commercial" group remains bearish, suggesting a continued decline in EUR/USD. The total number of long positions held by speculators is now 162,000, while short positions amount to 221,000.

For 20 consecutive weeks, large market participants have been reducing their euro holdings, reinforcing the long-term bearish trend. Occasionally, bullish weeks appear, but they remain exceptions rather than the rule. The main driver for a weaker U.S. dollar—expectations of FOMC monetary easing—has already been priced in. At this stage, there are no new fundamental reasons to short the dollar. Technical analysis confirms a continuation of the long-term bearish trend for EUR/USD. Thus, further downside movement is expected.

News calendar for the USA and the European Union:

USA – Consumer Price Index (13-30 UTC).

USA – Speech by FOMC President Jerome Powell (15-00 UTC).

On February 12, the calendar of economic events contains two very important entries. The influence of the information background on the market mood on Wednesday may be quite strong, but in the afternoon.

EUR/USD Trading Strategy & Recommendations

Selling of the pair was possible with a rebound from the 1.0335 – 1.0346 zone with targets of 1.0288 and 1.0213. The first target has been achieved. Today, sales of the euro currency are possible upon rebound from the level of 1.0373 with targets of 1.0335 and 1.0288. Sales from other levels can also be considered. Purchases could be considered near the level of 1.0288, but the trend now looks more like a "bearish" one.

Fibonacci Levels for Reference:

  • Hourly Chart: 1.0533 – 1.0213
  • 4-Hour Chart: 1.0603 – 1.1214
Samir Klishi,
Analytical expert of InstaForex
© 2007-2025
Select timeframe
5
min
15
min
30
min
1
hour
4
hours
1
day
1
week
Earn on cryptocurrency rate changes with InstaForex
Download MetaTrader 4 and open your first trade
  • Grand Choice
    Contest by
    InstaForex
    InstaForex always strives to help you
    fulfill your biggest dreams.
    JOIN CONTEST

Recommended Stories

Technical Analysis of Intraday Price Movement Nasdaq 100 Index, Friday May 02, 2025.

From what is seen on the 4-hour chart of the Nasdaq 100 index, the Stochastic Oscillator indicator is in a Crossing SELL condition and the appearance of a Rising Wedge

Arief Makmur 08:04 2025-05-02 UTC+2

Trading Signals for GOLD (XAU/USD) for May 1-3, 2025: buy above $3,203 (200 EMA - 5/8 Murray)

The price of the yellow metal is likely to trade between 3,203 and could reach the bottom of the bearish channel around 3,181 in the coming days, a level that

Dimitrios Zappas 17:49 2025-05-01 UTC+2

Trading Signals for EUR/USD for April 30, 2025: sell below 1.1376 (21 SMA - 7/8 Murray)

Early in the American session, the EUR/USD pair is trading around 1.1378 within the downtrend channel formed on April 17 and showing signs of exhaustion of bullish strength. A technical

Dimitrios Zappas 17:37 2025-04-30 UTC+2

Forex forecast 30/04/2025: EUR/USD, AUD/USD, USD/JPY, Gold, and Bitcoin

Useful links: My other articles are available in this section InstaForex course for beginners Popular Analytics Open trading account Important: The begginers in forex trading need to be very careful

Sebastian Seliga 16:31 2025-04-30 UTC+2

Trading Signals for GOLD (XAU/USD) for April 30, 2025: buy above $3,270 (21 SMA - 6/8 Murray)

Early in the American session, gold is trading around 3,384, above key support and rebounding after reaching 3,267. Gold is expected to regain strength if it consolidates above 3,381 (6/8

Dimitrios Zappas 15:07 2025-04-30 UTC+2

Forex forecast 29/04/2025: EUR/USD, GBP/USD, Gold, Ethereum and Bitcoin

Useful links: My other articles are available in this section InstaForex course for beginners Popular Analytics Open trading account Important: The begginers in forex trading need to be very careful

Sebastian Seliga 08:41 2025-04-30 UTC+2

Technical Analysis of Intraday Price Movement of AUD/JPY Cross Currency Pairs, Wednesday April 30, 2025.

With the appearance of Divergent and Descending Broadening Wedge patterns on the 4-hour chart of the AUD/JPY cross currency pair, although its price movement is below the EMA (21) which

Arief Makmur 06:19 2025-04-30 UTC+2

Technical Analysis of Intraday Price Movement of USD/JPY Main Currency Pairs, Wednesday April 30, 2025.

On the 4-hour chart of the main currency pair USD/JPY, it can be seen that the Stochastic Oscillator indicator forms a Double Bottom pattern while the price movement of USD/JPY

Arief Makmur 06:17 2025-04-30 UTC+2

Trading Signals for GOLD (XAU/USD) for April 29-30, 2025: buy above $3,310 (21 SMA - 7/8 Murray)

Early in the American session, gold is trading around the 3,310 level, where it is located at the 21SMA and within a symmetrical triangle pattern formed on April 23. Consolidation

Dimitrios Zappas 18:10 2025-04-29 UTC+2

Trading Signals for EUR/USD for April 29-30, 2025: sell below 1.1410 (symmetrical triangle - 7/8 Murray)

Our trading plan for the coming hours is to sell below 1.1410 with targets at 1.1370 and 1.1230. The eagle indicator is giving a negative signal, so we believe

Dimitrios Zappas 17:52 2025-04-29 UTC+2
Can't speak right now?
Ask your question in the chat.
Widget callback