GBP/USD 5-Minute Analysis
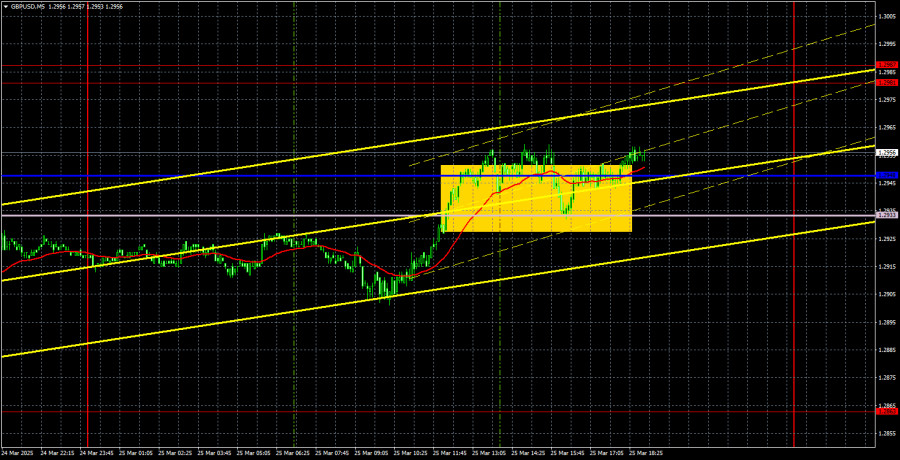
The GBP/USD currency pair showed growth again on Tuesday. "Again," because recently, all movements of the British currency resemble a "swing" or a "roller coaster" – first up, then down. Moreover, it can't even be said that the pair is trading in a flat or sideways channel. On the hourly timeframe, it's clear this is not the case. The direction of movement changes constantly, and the size of the moves is roughly the same.
There were no significant events in the UK on Tuesday, while in the US, the only report was on new home sales. It's safe to say that the British pound appreciated once again without any real reason. But this no longer comes as a surprise, because this is precisely what "swings" are about – up and down movement without solid justification. So yesterday the pound rose for no reason, and today it may just as easily fall.
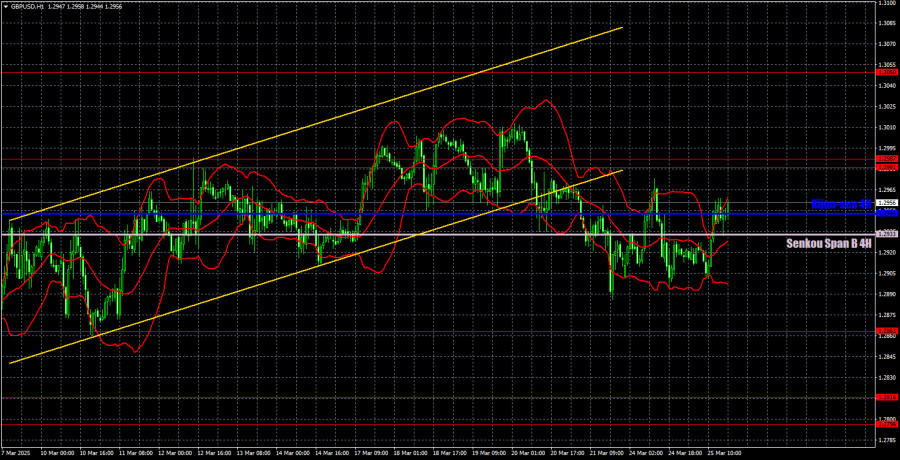
At the moment, the price is ignoring the Ichimoku indicator lines, which is another sign of a range-like structure that, in fact, is not truly a flat market. Movements are currently far from ideal, while different timeframes and the fundamental, political, and macroeconomic backdrop point in various directions, offering conflicting forecasts.
Formally, on the 5-minute chart, a buy signal was generated yesterday. Once again, the price technically broke through the Kijun-sen and Senkou Span B lines, but such breakouts are not ones we would recommend trading. Especially when you're aware of the ongoing "swings" or pseudo-flat market conditions.
COT Report
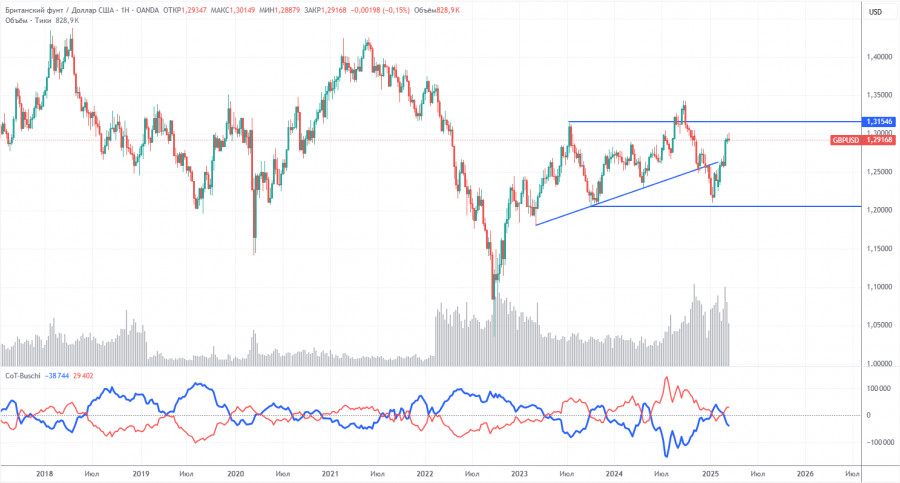
COT reports on the British pound show that commercial traders' sentiment has constantly changed in recent years. The red and blue lines, representing the net positions of commercial and non-commercial traders, intersect frequently and are mainly close to the zero level. They are also near each other, indicating that the number of long and short positions is roughly equal.
On the weekly chart, the price first broke the 1.3154 level and then dropped to the trendline, which it successfully breached. Breaking the trendline suggests that the pound is likely to continue falling. However, we should note a rebound from the second-to-last local low on the weekly chart. We may be dealing with a flat market.
According to the latest COT report on the British pound, the "Non-commercial" group opened 1,100 buy contracts and 900 sell contracts. As a result, the net position of non-commercial traders saw little change over the week.
The current fundamental backdrop does not support long-term buying of the pound, and the currency has a real possibility of continuing its global downward trend. The recent sharp increase in the pound's value can be attributed solely to Donald Trump's policies.
GBP/USD 1-Hour Analysis
On the hourly timeframe, the GBP/USD pair has initiated a downtrend, but the decline so far is very mild. The upward correction on the daily chart has long been due to end. We still don't see any real basis for sterling to rise in the long term. Right now, the only thing working in favor of the pound is Donald Trump, who is introducing sanctions and tariffs left and right. All other factors are being ignored by the market. The pound hasn't even managed to properly correct after a 650-pip rally.
For March 26, we highlight the following important levels: 1.2331–1.2349, 1.2429–1.2445, 1.2511, 1.2605–1.2620, 1.2691–1.2701, 1.2796–1.2816, 1.2863, 1.2981–1.2987, 1.3050, 1.3119. The Senkou Span B (1.2933) and Kijun-sen (1.2948) lines may also serve as signal sources. It is recommended to set the Stop Loss at breakeven once the price has moved 20 pips in the right direction. The Ichimoku indicator lines may shift throughout the day, which should be taken into account when identifying trading signals.
On Wednesday, the UK will publish its inflation report for February... Why anyone would be interested in February's inflation data at the end of March is unclear. However, this will be the second estimate, which usually matches the first. In the US, a more important report on durable goods orders will be released, but we remind you that macroeconomic statistics currently mean very little to traders.
Illustration Explanations:
- Support and Resistance Levels (thick red lines): Thick red lines indicate where movement may come to an end. Please note that these lines are not sources of trading signals.
- Kijun-sen and Senkou Span B Lines: Ichimoku indicator lines transferred from the 4-hour timeframe to the hourly timeframe. These are strong lines.
- Extreme Levels (thin red lines): Thin red lines where the price has previously bounced. These serve as sources of trading signals.
- Yellow Lines: Trendlines, trend channels, or any other technical patterns.
- Indicator 1 on COT Charts: Represents the net position size for each category of traders.


