


signal strength 1 of 5

The Triple Bottom pattern has been formed on #Bitcoin M5. It has the following characteristics: resistance level 83143.83/82884.57; support level 82680.13/82625.22; the width is 46370 points. In the event of a breakdown of the resistance level of 83143.83, the price is likely to continue an upward movement at least to 82669.54.
The M5 and M15 time frames may have more false entry points.
- All
- Double Top
- Flag
- Head and Shoulders
- Pennant
- Rectangle
- Triangle
- Triple top
- All
- #AAPL
- #AMZN
- #Bitcoin
- #EBAY
- #FB
- #GOOG
- #INTC
- #KO
- #MA
- #MCD
- #MSFT
- #NTDOY
- #PEP
- #TSLA
- #TWTR
- AUDCAD
- AUDCHF
- AUDJPY
- AUDUSD
- EURCAD
- EURCHF
- EURGBP
- EURJPY
- EURNZD
- EURRUB
- EURUSD
- GBPAUD
- GBPCHF
- GBPJPY
- GBPUSD
- GOLD
- NZDCAD
- NZDCHF
- NZDJPY
- NZDUSD
- SILVER
- USDCAD
- USDCHF
- USDJPY
- USDRUB
- All
- M5
- M15
- M30
- H1
- D1
- All
- Buy
- Sale
- All
- 1
- 2
- 3
- 4
- 5

According to the chart of M5, EURJPY formed the Inverse Head and Shoulder pattern. The Head’s top is set at 164.66 while the median line of the Neck is found
The M5 and M15 time frames may have more false entry points.
Open chart in a new window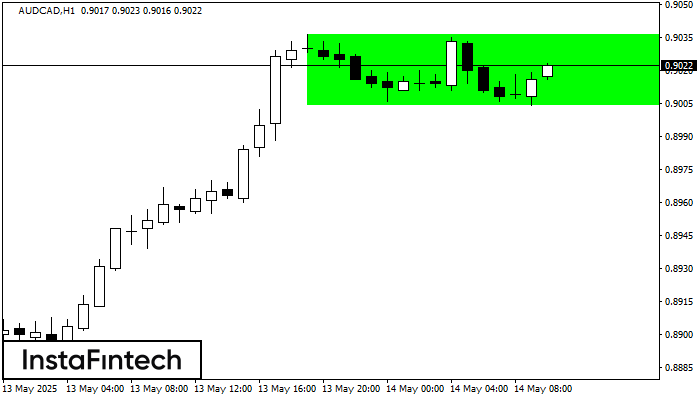
According to the chart of H1, AUDCAD formed the Bullish Rectangle. The pattern indicates a trend continuation. The upper border is 0.9036, the lower border is 0.9004. The signal means
Open chart in a new window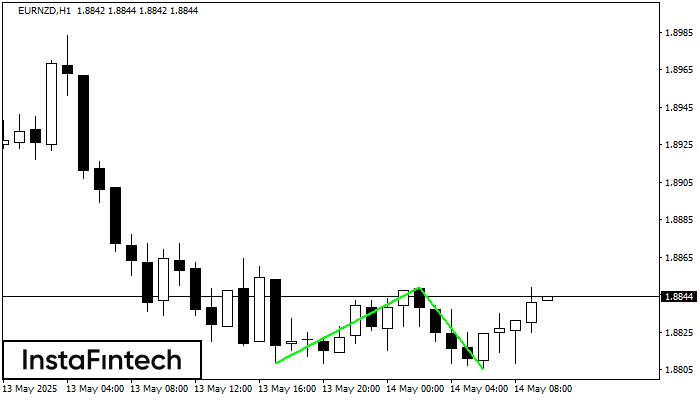
The Double Bottom pattern has been formed on EURNZD H1. This formation signals a reversal of the trend from downwards to upwards. The signal is that a buy trade should
Open chart in a new window


