empty
 
 
27.09.2024 10:47 AM
EUR/USD and GBP/USD: technical analysis on September 27, 2024

EUR/USD

This image is no longer relevant

Larger timeframes

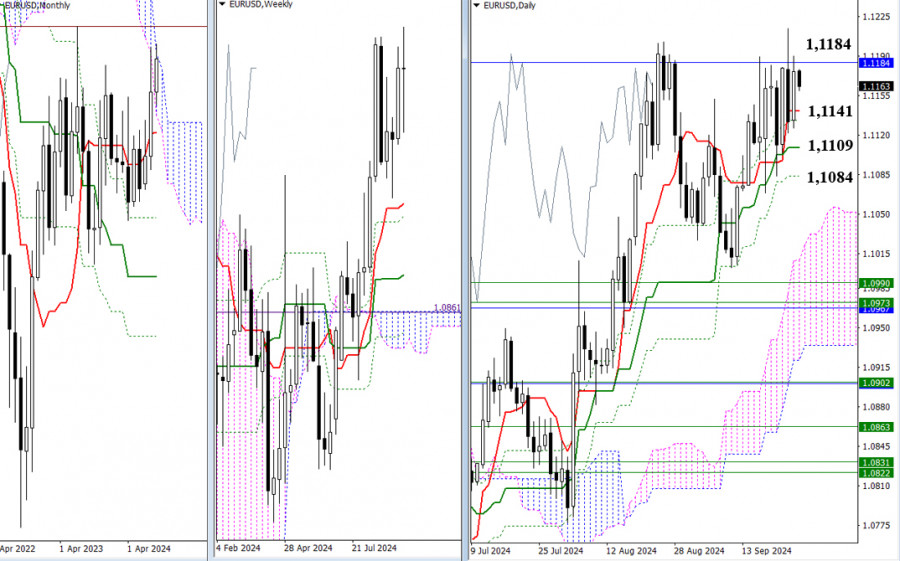
This week, the EUR/USD pair has been consolidating below the upper border of the one-month cloud (1.1184). Bearish traders have managed a few times to destroy all of their opponents' gains, bringing the price back to the short-term daily trend channel. As a result, the consolidation range and the current uncertainty can now be defined by the one-month resistance at 1.1184 and the support levels of the daily Ichimoku cross (1.1141 – 1.1133 – 1.1109 – 1.1084). If the instrument breaks out beyond these levels and firmly settles outside these borders, this will open up new prospects for EUR/USD.

This image is no longer relevant

H4 – H1 timeframes

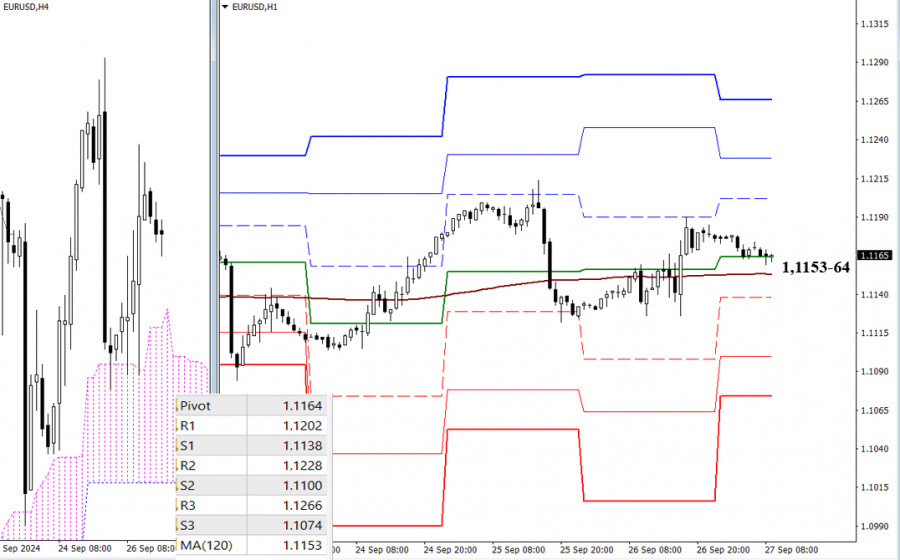
On the lower timeframes, key levels of 1.1153 – 1.1164 (the central pivot level of the day + the weekly long-term trend) remain horizontal, maintaining uncertainty. The instrument is fluctuating above and below these levels, winding around the trend line. If a directional movement develops, attention will shift to other reference points on the lower timeframes. In the case of an upward move, the resistances of the classic Pivot levels (1.1202 – 1.1228 – 1.1266) will be of interest to bulls. If the EUR/USD pair declines, the classic Pivot level supports (1.1138 – 1.1100 – 1.1074) may come into play.

***

GBP/USD

This image is no longer relevant

Larger timeframes

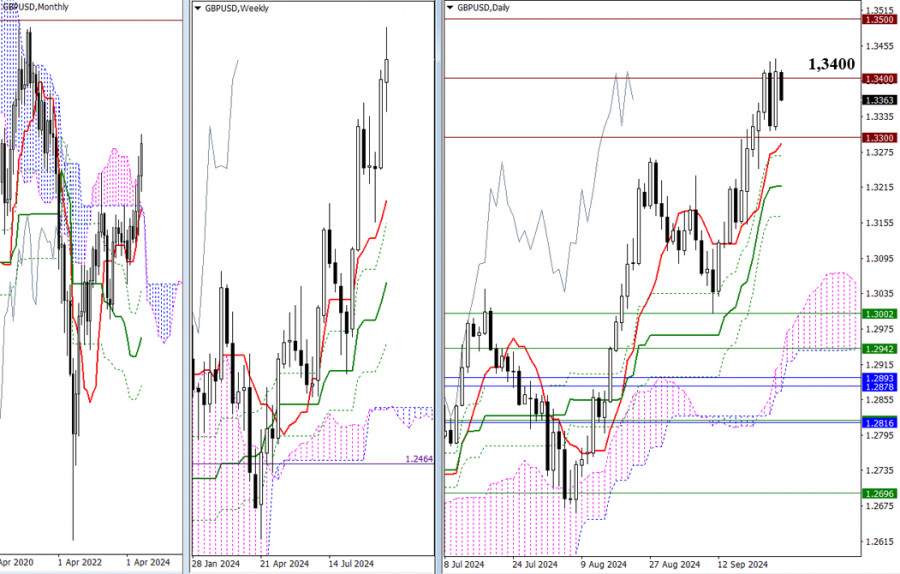
As the week is coming to an end, the market is still struggling to decide on the 1.3400 level. A breakout of this level will pave the way for new bullish prospects, potentially driving the price toward the next psychological resistance at 1.3500. A rejection will bring the price back to the previous level of 1.3300, followed by testing the supports of the daily Ichimoku cross (1.3289 – 1.3217 – 1.3166). Let's wait for the week's close to see which trading force secures the advantage, though uncertainty may prevail at this stage.

This image is no longer relevant

H4 – H1 timeframes

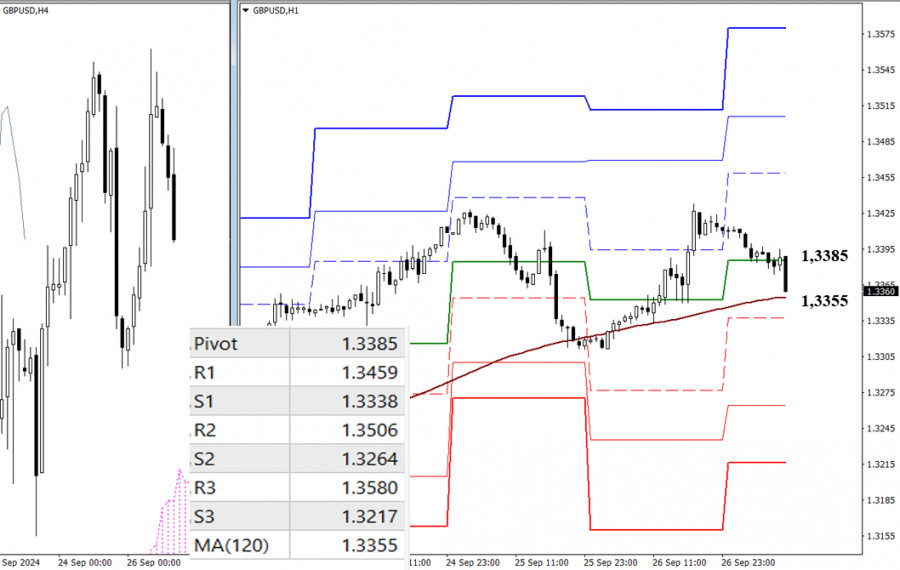
On the lower timeframes, the market is descending toward key support levels, located today at 1.3385 – 1.3355 (central Pivot level + weekly long-term trend). Control of the trend provides the primary advantage. Additional intraday reference points are the classic Pivot levels, meaning an upward move would pass through resistances (1.3459 – 1.3506 – 1.3580), while a downward move would go through supports (1.3338 – 1.3264 – 1.3217).

***

This technical analysis is based on the following ideas:

Larger timeframes - Ichimoku Kinko Hyo (9.26.52) + Fibo Kijun levels

H1 – classic pivot points + 120-period Moving Avarage (weekly long-term trendline)

Evangelos Poulakis,
InstaForex के विश्लेषणात्मक विशेषज्ञ
© 2007-2024
Earn on cryptocurrency rate changes with InstaForex
Download MetaTrader 4 and open your first trade
  • Grand Choice
    Contest by
    InstaForex
    InstaForex always strives to help you
    fulfill your biggest dreams.
    कॉन्टेस्ट में हिस्सा लें
  • चैन्सी डिपॉजिट
    $ 3,000 के साथ अपना खाता जमा करें और प्राप्त करें $3000 अधिक!
    में सितंबर हम आकर्षित करते हैं $3000 चैंसी डिपॉज़िट में
    ट्रेडिंग अकाउंट में $ 3,000 जमा करके जीतने का अवसर प्राप्त करें इस शर्त को पूरा करके आप प्रतियोगिता में भाग ले सकते हैं
    कॉन्टेस्ट में हिस्सा लें
  • ट्रेड वाइज़, विन डिवाइस
    कम से कम $500 के साथ अपने खाते में टॉप अप करें, कॉन्टेस्ट के लिए साइन अप करें और मोबाइल डिवाइस जीतने का मौका पाएं।
    कॉन्टेस्ट में हिस्सा लें
  • 100% बोनस
    अपनी जमा राशि पर 100% बोनस प्राप्त करने का आपका अनूठा अवसर
    बोनस पायें
  • 55% बोनस
    अपनी प्रत्येक डिपॉजिट पर 55% बोनस के लिए आवेदन करें
    बोनस पायें
  • 30% बोनस
    हर बार खाता टॉप अप करने पर 30% बोनस प्राप्त करें
    बोनस पायें

अनुशंसित लेख

अभी बात नहीं कर सकते?
अपना प्रश्न पूछें बातचीत.
Widget callback