empty
17.11.2022 01:34 PM
Technical analysis of EUR/USD for November 17, 2022

This image is no longer relevant

Overview :

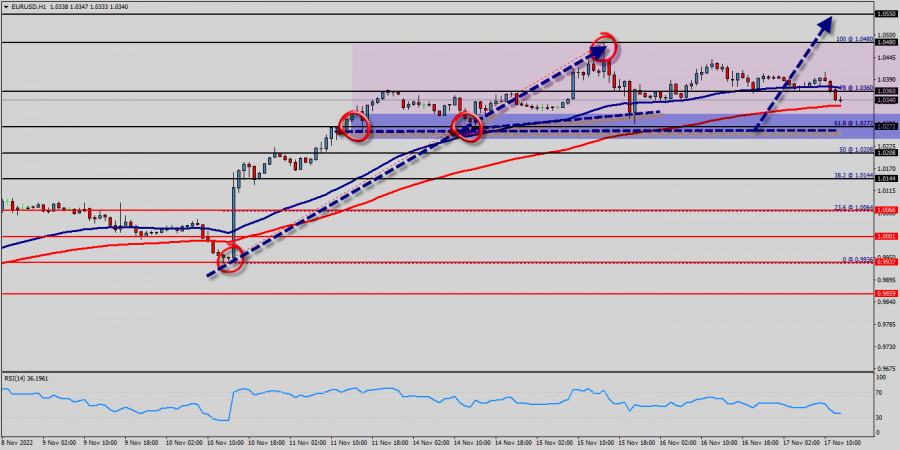
The EUR/USD pair's rise from 1.0272 is still in progress and intraday bias stays on the upside for 1.0272 resistance first on the one-hour chart. All elements being clearly bullish market, it would be possible for traders to trade only long positions on the EUR/USD pair as long as the price remains well above the price of 1.0272. The EUR/USD pair will continue rising from the level of 1.0272 in the long term. It should be noted that the support is established at the level of 1.0272 which represents the daily pivot point. The price is likely to form a double bottom in the same time frame. Accordingly, the EUR/USD pair is showing signs of strength following a breakout of the highest level of 1.0340. This suggests that the pair will probably go up in coming hours.

If the trend is able to break the level of 1.0340, then the market will call for a strong bullish market towards the objectives between 1.0272 ans 1.0480 this week. Currently, the price is in a bullish channel. This is confirmed by the RSI indicator signaling that we are still in a bullish trending market. As the price is still above the moving average (100), immediate support is seen at 1.0272, which coincides with a key ratio (61.8% of Fibonacci). The EUR/USD pair swing around the breached resistance of the bullish channel and keeps its stability above it until now, noticing that the EMA50 continues to resistance the price from above, while RSI begins to overlap positively.

Thus, the market is indicating a bullish opportunity above the above-mentioned support levels, for that the bullish outlook remains the same as long as the 100 EMA is headed to the upside. So, buy above the level of 1.0340 with the first target at 1.0360 in order to test the daily resistance 1. The buyers' bullish objective is set at the level of 1.0480. A bullish break in this resistance would boost the bullish momentum. The buyers could then target the resistance located at 1.0480. If there is any crossing, the next objective would be the resistance located at 1.0480. The level of 1.0550 is a good place to take profits.

Moreover, the RSI is still signaling that the trend is upward as it remains strong above the moving average (100). However, beware of bullish excesses that could lead to a possible short-term correction; but this possible correction would not be tradeable.

On the other hand, in case a reversal takes place and the EUR/USD pair breaks through the support level of 1.0272, a further decline to 1.0208 and 1.0144 can occur. It would indicate a bearish market.

Pilih carta masa
5
min
15
min
30
min
1
jam
4
jam
1
hari
1
minggu
Jana pendapatan melalui perubahan kadar mata wang kripto dengan InstaForex.
Muat turun MetaTrader 4 dan buka dagangan pertama anda.
  • Grand Choice
    Contest by
    InstaForex
    InstaForex always strives to help you
    fulfill your biggest dreams.
    SERTAI PERADUAN

Artikel yang dicadangkan

Ramalan USD/JPY untuk 24 Jun, 2025

USD/JPY Gambaran teknikal pada hari Isnin berpotensi membentuk hala tuju perkembangan jangka sederhana. Minggu ini dibuka dengan jurang harga menaik (gap up), diikuti oleh pembentukan bayang atas yang panjang. Penutupan

Laurie Bailey 04:44 2025-06-24 UTC+2

USD/JPY. Analisis dan Ramalan. Situasi Pasaran Semasa

Dari perspektif teknikal, memandangkan kenaikan harga telah melepasi halangan Purata Pergerakan Sederhana (SMA) 100-hari sekitar tahap 146.80, mereka masih menguasai. Pembelian melepasi tahap psikologi 147.00 mengesahkan pandangan positif, mendorong harga

Irina Yanina 17:53 2025-06-23 UTC+2

Isyarat Dagangan untuk EUR/USD bagi 23-28 Jun, 2025: beli di atas 1.1460 (21 SMA - 6/8 Murray)

Sebaliknya, kawasan sekitar 21SMA, terletak di tahap psikologi 1.15, adalah penting. Di bawah kawasan ini, kita mungkin dapat menjangkakan adanya penembusan mendadak dalam saluran aliran menaik, dan euro mungkin jatuh

Dimitrios Zappas 16:34 2025-06-23 UTC+2

Analisis Teknikal untuk Minggu 23–28 Jun: Pasangan Mata Wang GBP/USD

Minggu lalu, pasangan ini bergerak menurun dan menguji paras lantunan semula 14.6% pada 1.3392 (garis putus-putus merah), sebelum harga melantun dan menutup lilin mingguan pada 1.3446. Dalam minggu yang akan

Stefan Doll 11:38 2025-06-23 UTC+2

Analisis Teknikal untuk Minggu 23–28 Jun: Pasangan Mata Wang EUR/USD

Minggu lepas, pasangan ini bergerak ke bawah dan menguji tahap penarikan semula 76.4% pada 1.1452 (garisan putus-putus merah), selepas itu harga melantun semula dan menutup lilin mingguan pada 1.1520. Pada

Stefan Doll 11:31 2025-06-23 UTC+2

Ramalan untuk EUR/USD pada 23 Jun 2025

Pada hari Jumaat, pasangan EUR/USD meneruskan kenaikan selepas melantun dari paras pembetulan 76.4% pada 1.1454. Namun, pada awal pagi Isnin, pasangan ini kembali ke paras tersebut. Lantunan semula ini membolehkan

Samir Klishi 11:24 2025-06-23 UTC+2

Ramalan untuk GBP/USD pada 23 Jun 2025

Pada carta setiap jam, pasangan GBP/USD pada hari Jumaat mengukuhkan kedudukan di bawah zon sokongan 1.3425–1.3444, sekali lagi membolehkan jangkaan penurunan berterusan menuju tahap sokongan 1.3357–1.3373. Pemulihan dari

Samir Klishi 11:19 2025-06-23 UTC+2

Analisis Teknikal Pergerakan Harga Harian Pasangan Matawang Eksotik USD/IDR, Isnin 23 Jun 2025.

16473.27 Pada carta Harian sekarang, pasangan mata wang Eksotik USD/IDR menunjukkan corak Bullish 123, yang menunjukkan bahawa USD/IDR sedang mengukuh, di mana ini juga disahkan oleh pergerakan harga pasangan mata

Arief Makmur 07:29 2025-06-23 UTC+2

Analisis Teknikal Pergerakan Harga Intraday Instrumen Komoditi Minyak Mentah, Isnin 23 Jun 2025.

Selain kemunculan Perbezaan antara pergerakan harga Minyak Mentah dan penunjuk Pengayun Stochastic pada carta 4 jam, terdapat juga corak Bearish 123 dan corak Segi Tiga yang kesemuanya menunjukkan bahawa dalam

Arief Makmur 07:29 2025-06-23 UTC+2

Ramalan EUR/USD untuk 23 Jun 2025

Satu perbezaan menurun telah terbentuk pada carta mingguan untuk euro. Kami bersiap sedia untuk pembalikan ke arah aliran menurun jangka panjang, tetapi perbezaan dengan jurang sering berkembang dengan cara yang

Laurie Bailey 05:00 2025-06-23 UTC+2
Tidak boleh bertanya sekarang?
Tanya soalan anda di Ruangan bersembang.
Panggilan semula Widget
 

Dear visitor,

Your IP address shows that you are currently located in the USA. If you are a resident of the United States, you are prohibited from using the services of InstaFintech Group including online trading, online transfers, deposit/withdrawal of funds, etc.

If you think you are seeing this message by mistake and your location is not the US, kindly proceed to the website. Otherwise, you must leave the website in order to comply with government restrictions.

Why does your IP address show your location as the USA?

  • - you are using a VPN provided by a hosting company based in the United States;
  • - your IP does not have proper WHOIS records;
  • - an error occurred in the WHOIS geolocation database.

Please confirm whether you are a US resident or not by clicking the relevant button below. If you choose the wrong option, being a US resident, you will not be able to open an account with InstaForex anyway.

We are sorry for any inconvenience caused by this message.