Overview :
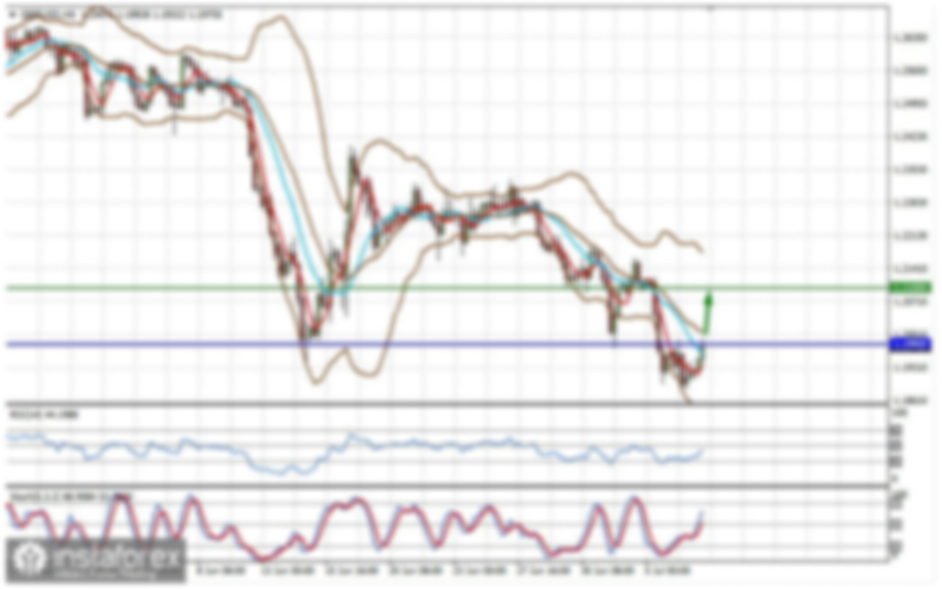
The GBP/USD pair continues to move downwards from the level of 1.2216. According to the previous events, the GBP/USD pair is still moving between the levels of 1.2216 and 1.2122. On the one-hour chart, immediate support level is seen at 1.2153, which coincides with a ratio of 00% Fibonacci retracement - last bearish wave.
Currently, the price is moving in a bearish channel. This is confirmed by the RSI indicator signaling that we are still in a bearish trending market. The price is still above the moving average (100) and (50). Therefore, if the trend is able to break out through the first support level of 1.2153, we would see the pair climbing towards the daily support at 1.2122 to test it.
It would also be wise to consider where to place stop loss; this should be set below the second support of 1.2343. It should always be noted that : If the trend is up ward, the strength of the currency will be defined as follows: GBP is in an uptrend and USD is in a downtrend. The stop loss should never exceed your maximum exposure amounts. The market is highly volatile if the last day had huge volatility.
Overview : The market opened below the weekly pivot point (1.2354). It continued to move downwards from the level of 1.2354 to the bottom around 1.2235. But, the trend rebounded from the bottom of 1.2253 to set around the area of 1.2290. The first resistance level is seen at 1.2354 followed by 1.2390, while daily support 1 is seen at 1.2235. The GBP/USD pair broke support which turned to strong resistance at 1.2354.
Right now, the pair is trading below this level. It is likely to trade in a lower range as long as it remains below the resistance (1.2354) which is expected to act as major resistance today. This would suggest a bearish market because the moving average (100) is still in a negative area and does not show any signs of a trend reversal at the moment. Amid the previous events, the GBP/USD pair is still moving between the levels of 1.2354 and 1.2200, so we expect a range of 154 pips in coming days.
Therefore, the major resistance can be found at 1.2354 providing a clear signal to sell with a target seen at 1.2235. If the trend breaks the minor support at 1.2235, the pair will move downwards continuing the bearish trend development to the level of 1.2200 in order to test the daily support 2. Overall, we still prefer the bearish scenario which suggests that the pair will stay below the zone of 1.2354. this week. Currently, the price is in a bearish channel. This is confirmed by the RSI indicator signaling that we are still in a bullish trending market.
The bias remains bearish in the nearest term testing 1.2235 and 1.2200. Immediate resistance is seen around 1.2354 levels, which coincides with the weekly pivot. Moreover, the moving average (100) starts signaling a downward trend; therefore, the market is indicating a bearish opportunity below 1.2354. So it will be good to sell at 1.2235 with the first target of 1.2200. It will also call for a downtrend in order to continue towards 1.2175. The strong weekly support is seen at 1.2175.
However, if a breakout happens at the resistance level of 1.2353, then this scenario may be invalidated.Equally important, the price is in a bullish channel. According to the previous events, we expect the GBP/USD pair to move between 1.2495 and 1.2153. This would suggest a bullish market because the RSI indicator is still in a positive area and does not show any trend-reversal signs. Therefore, strong support will be formed at the level of 1.2195 5providing a clear signal to buy with the target seen at 1.2460.
If the trend breaks the resistance at 1.2460 (first resistance), the pair will move upwards continuing the development of the bullish trend to the level 1.2495 in order to test the daily resistance 2. In the same time frame, resistance is seen at the levels of 1.2495 and 1.2500. The stop loss should always be taken into account for that it will be reasonable to set your stop loss at the level of 1.2326 (below the support 2). If the price of Pound Sterling is trading above 1.2583 then possibility of upside targets getting achieved is higher around the level of 1.2783. The basic bullish trend is very strong on the GBP/USD pair, but the short term shows some signs of running out of steam. Nevertheless, a purchase could be considered as long as the price remains above 1.2461.
Crossing the first resistance at 1.2583 would be a sign of a potential new surge in the price. Buyers would then use the next resistance located at 1.2583 as an objective. Crossing it would then enable buyers to target 1.2583. Caution, a return to below 1.2583 would be a sign of a consolidation phase in the short-term basic trend. If this is the case, remember that trading against the trend may be riskier. It would seem more appropriate to wait for a signal indicating reversal of the trend.
In the very short term, the general bullish sentiment is not called into question, despite technical indicators being indecisive. All elements being clearly bullish market, it would be possible for traders to trade only long positions on the GBP/USD pair as long as the price remains well above the price of 1.2461. A bullish break in this resistance would boost the bullish momentum. The buyers could then target the resistance located at 1.2583. This suggests that the pair will probably go up in coming hours. If the trend is able to break the level of 1.2583 (double top), then the market will call for a strong bullish market towards the objective of 1.2615 this week.