signal strength 1 of 5
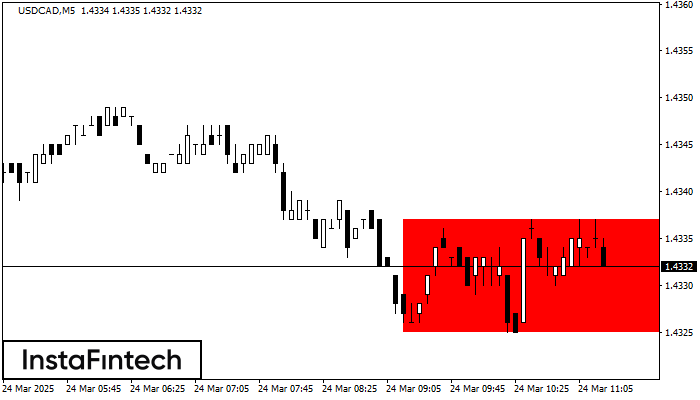
According to the chart of M5, USDCAD formed the Bearish Rectangle which is a pattern of a trend continuation. The pattern is contained within the following borders: lower border 1.4325 – 1.4325 and upper border 1.4337 – 1.4337. In case the lower border is broken, the instrument is likely to follow the downward trend.
The M5 and M15 time frames may have more false entry points.
- All
- Double Top
- Flag
- Head and Shoulders
- Pennant
- Rectangle
- Triangle
- Triple top
- All
- #AAPL
- #AMZN
- #Bitcoin
- #EBAY
- #FB
- #GOOG
- #INTC
- #KO
- #MA
- #MCD
- #MSFT
- #NTDOY
- #PEP
- #TSLA
- #TWTR
- AUDCAD
- AUDCHF
- AUDJPY
- AUDUSD
- EURCAD
- EURCHF
- EURGBP
- EURJPY
- EURNZD
- EURRUB
- EURUSD
- GBPAUD
- GBPCHF
- GBPJPY
- GBPUSD
- GOLD
- NZDCAD
- NZDCHF
- NZDJPY
- NZDUSD
- SILVER
- USDCAD
- USDCHF
- USDJPY
- USDRUB
- All
- M5
- M15
- M30
- H1
- D1
- All
- Buy
- Sale
- All
- 1
- 2
- 3
- 4
- 5
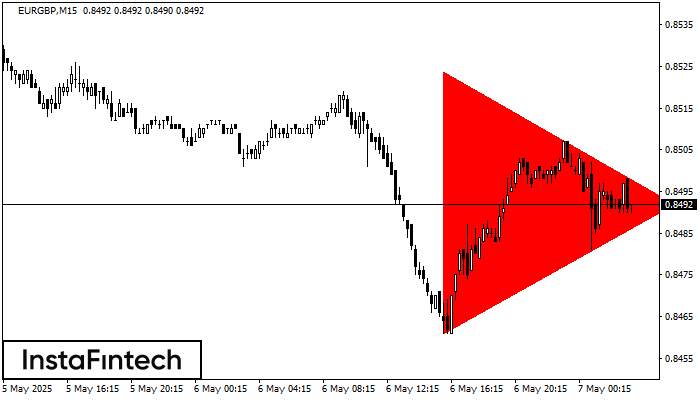
Berdasarkan carta M15, EURGBP membentuk corak Segi Tiga Simetri Menurun. Cadangan dagangan: Penembusan sempadan bawah 0.8461 mungkin mendorong kepada kesinambungan aliran menurun
Carta masa M5 dan M15 mungkin mempunyai lebih banyak titik kemasukan palsu.
Open chart in a new window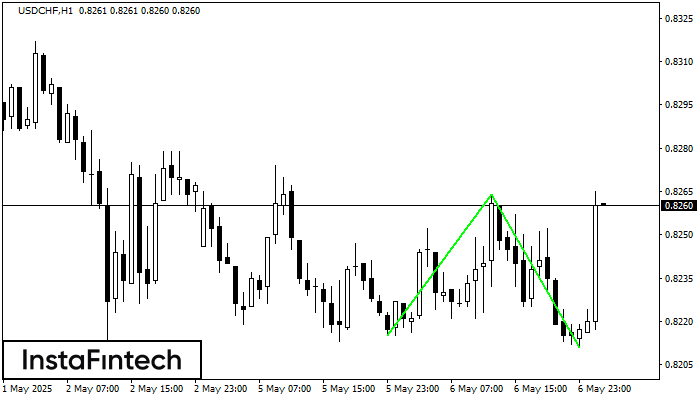
Corak Double Bottom telah dibentuk pada USDCHF H1; sempadan atas adalah 0.8264; sempadan bawah adalah 0.8211. Lebar corak adalah 49 mata. Sekiranya penembusan sempadan atas 0.8264, perubahan aliran boleh diramalkan
Open chart in a new window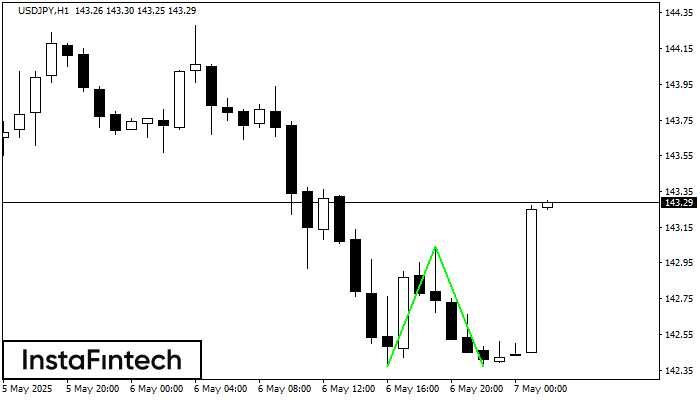
Corak Double Bottom telah dibentuk pada USDJPY H1. Ciri-ciri: tahap sokongan 142.37; tahap rintangan 143.04; lebar corak 67 mata. Sekiranya tahap rintangan ditembusi, perubahan aliran boleh diramalkan dengan titik sasaran
Open chart in a new window