signal strength 1 of 5
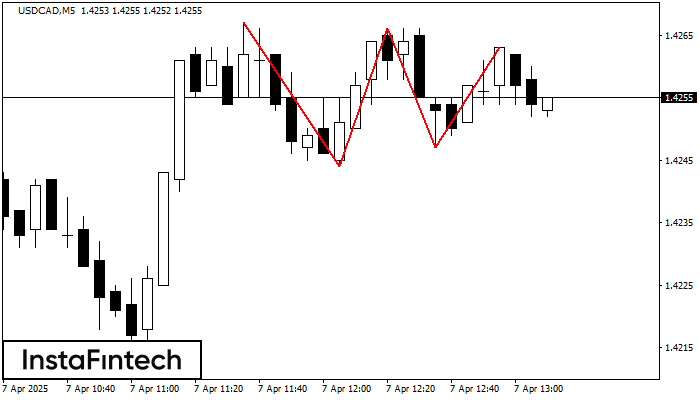
On the chart of the USDCAD M5 trading instrument, the Triple Top pattern that signals a trend change has formed. It is possible that after formation of the third peak, the price will try to break through the resistance level 1.4244, where we advise to open a trading position for sale. Take profit is the projection of the pattern’s width, which is 23 points.
The M5 and M15 time frames may have more false entry points.
- All
- Double Top
- Flag
- Head and Shoulders
- Pennant
- Rectangle
- Triangle
- Triple top
- All
- #AAPL
- #AMZN
- #Bitcoin
- #EBAY
- #FB
- #GOOG
- #INTC
- #KO
- #MA
- #MCD
- #MSFT
- #NTDOY
- #PEP
- #TSLA
- #TWTR
- AUDCAD
- AUDCHF
- AUDJPY
- AUDUSD
- EURCAD
- EURCHF
- EURGBP
- EURJPY
- EURNZD
- EURRUB
- EURUSD
- GBPAUD
- GBPCHF
- GBPJPY
- GBPUSD
- GOLD
- NZDCAD
- NZDCHF
- NZDJPY
- NZDUSD
- SILVER
- USDCAD
- USDCHF
- USDJPY
- USDRUB
- All
- M5
- M15
- M30
- H1
- D1
- All
- Buy
- Sale
- All
- 1
- 2
- 3
- 4
- 5
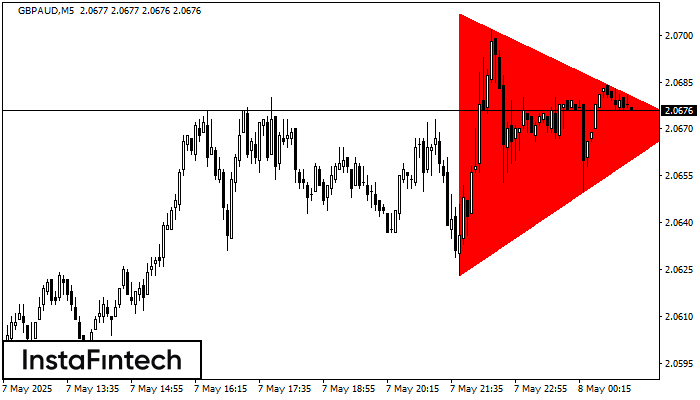
Berdasarkan carta M5, GBPAUD membentuk corak Segi Tiga Simetri Menurun. Cadangan dagangan: Penembusan sempadan bawah 2.0623 mungkin mendorong kepada kesinambungan aliran menurun
Carta masa M5 dan M15 mungkin mempunyai lebih banyak titik kemasukan palsu.
Open chart in a new window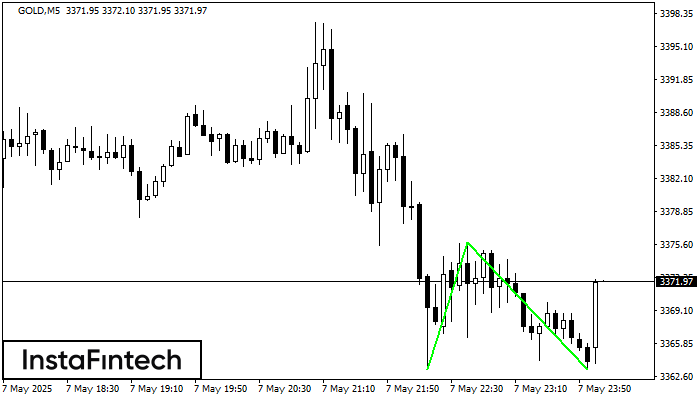
Corak Double Bottom telah dibentuk pada GOLD M5; sempadan atas adalah 3375.87; sempadan bawah adalah 3363.32. Lebar corak adalah 1258 mata. Sekiranya penembusan sempadan atas 3375.87, perubahan aliran boleh diramalkan
Carta masa M5 dan M15 mungkin mempunyai lebih banyak titik kemasukan palsu.
Open chart in a new window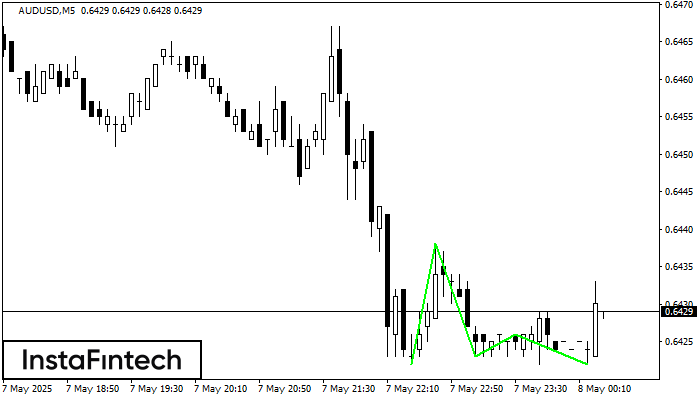
Corak Triple Bottom telah dibentuk pada carta AUDUSD M5. Ciri-ciri corak: Garisan bawah corak mempunyai koordinat 0.6438 dengan had atas 0.6438/0.6426, unjuran lebar adalah 16 mata. Pembentukan corak Triple Bottom
Carta masa M5 dan M15 mungkin mempunyai lebih banyak titik kemasukan palsu.
Open chart in a new window