signal strength 3 of 5
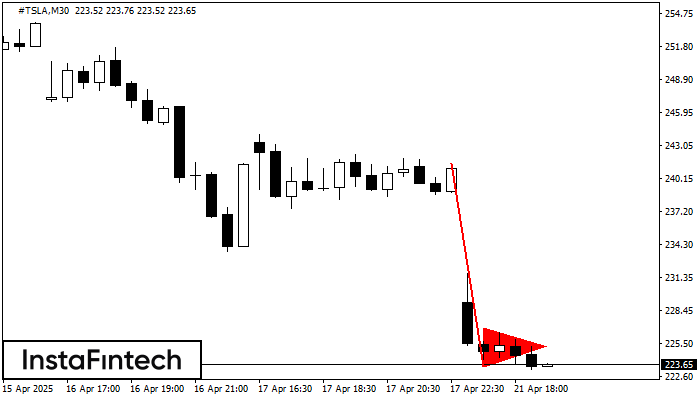
The Bearish pennant pattern has formed on the #TSLA M30 chart. It signals potential continuation of the existing trend. Specifications: the pattern’s bottom has the coordinate of 223.47; the projection of the flagpole height is equal to 1803 pips. In case the price breaks out the pattern’s bottom of 223.47, the downtrend is expected to continue for further level 223.17.
- All
- Double Top
- Flag
- Head and Shoulders
- Pennant
- Rectangle
- Triangle
- Triple top
- All
- #AAPL
- #AMZN
- #Bitcoin
- #EBAY
- #FB
- #GOOG
- #INTC
- #KO
- #MA
- #MCD
- #MSFT
- #NTDOY
- #PEP
- #TSLA
- #TWTR
- AUDCAD
- AUDCHF
- AUDJPY
- AUDUSD
- EURCAD
- EURCHF
- EURGBP
- EURJPY
- EURNZD
- EURRUB
- EURUSD
- GBPAUD
- GBPCHF
- GBPJPY
- GBPUSD
- GOLD
- NZDCAD
- NZDCHF
- NZDJPY
- NZDUSD
- SILVER
- USDCAD
- USDCHF
- USDJPY
- USDRUB
- All
- M5
- M15
- M30
- H1
- D1
- All
- Buy
- Sale
- All
- 1
- 2
- 3
- 4
- 5
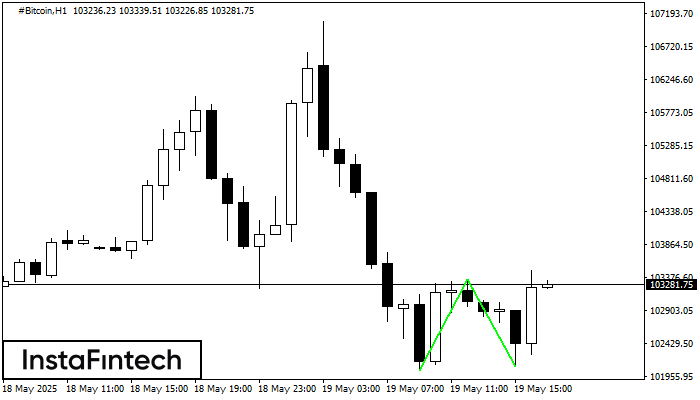
Corak Double Bottom telah dibentuk pada #Bitcoin H1. Pembentukan ini menandakan pembalikan aliran dari aliran menurun ke atas. Isyarat ialah perdagangan membeli harus dibuka selepas sempadan atas corak 103355.86 telah
Open chart in a new window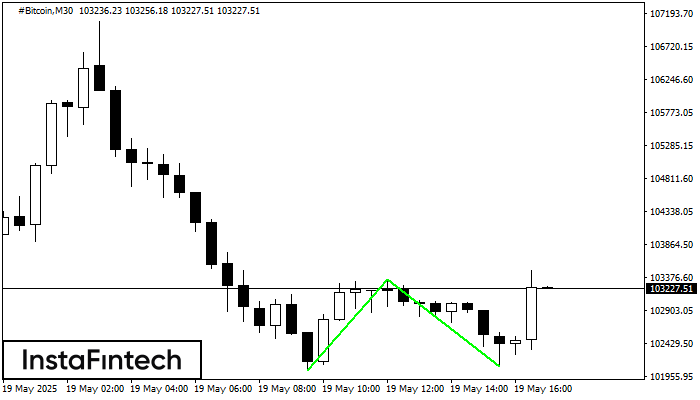
Corak Double Bottom telah dibentuk pada #Bitcoin M30; sempadan atas adalah 103355.86; sempadan bawah adalah 102090.12. Lebar corak adalah 131679 mata. Sekiranya penembusan sempadan atas 103355.86, perubahan aliran boleh diramalkan
Open chart in a new window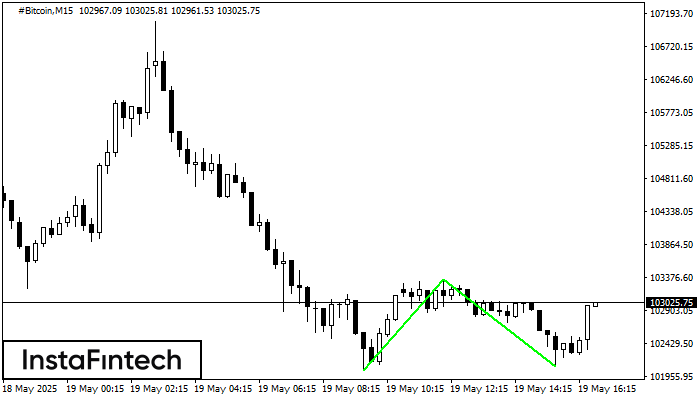
Corak Double Bottom telah dibentuk pada #Bitcoin M15; sempadan atas adalah 103355.86; sempadan bawah adalah 102090.12. Lebar corak adalah 131679 mata. Sekiranya penembusan sempadan atas 103355.86, perubahan aliran boleh diramalkan
Carta masa M5 dan M15 mungkin mempunyai lebih banyak titik kemasukan palsu.
Open chart in a new window