


signal strength 2 of 5
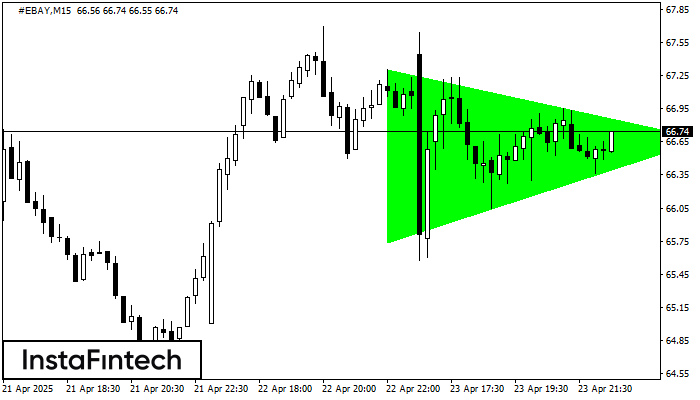
According to the chart of M15, #EBAY formed the Bullish Symmetrical Triangle pattern. Description: This is the pattern of a trend continuation. 67.31 and 65.74 are the coordinates of the upper and lower borders respectively. The pattern width is measured on the chart at 157 pips. Outlook: If the upper border 67.31 is broken, the price is likely to continue its move by 66.89.
The M5 and M15 time frames may have more false entry points.
- All
- Double Top
- Flag
- Head and Shoulders
- Pennant
- Rectangle
- Triangle
- Triple top
- All
- #AAPL
- #AMZN
- #Bitcoin
- #EBAY
- #FB
- #GOOG
- #INTC
- #KO
- #MA
- #MCD
- #MSFT
- #NTDOY
- #PEP
- #TSLA
- #TWTR
- AUDCAD
- AUDCHF
- AUDJPY
- AUDUSD
- EURCAD
- EURCHF
- EURGBP
- EURJPY
- EURNZD
- EURRUB
- EURUSD
- GBPAUD
- GBPCHF
- GBPJPY
- GBPUSD
- GOLD
- NZDCAD
- NZDCHF
- NZDJPY
- NZDUSD
- SILVER
- USDCAD
- USDCHF
- USDJPY
- USDRUB
- All
- M5
- M15
- M30
- H1
- D1
- All
- Buy
- Sale
- All
- 1
- 2
- 3
- 4
- 5

Corak Triple Bottom telah dibentuk pada GBPCHF H1. Ia mempunyai ciri-ciri berikut: tahap rintangan 1.0997/1.0988; tahap sokongan 1.0919/1.0919; lebar corak adalah 78 mata. Dalam situasi penembusan paras rintangan 1.0997, harga
Open chart in a new window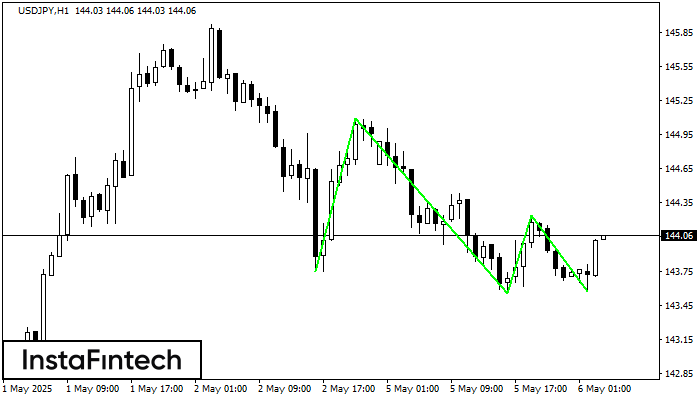
Corak Triple Bottom telah dibentuk pada carta USDJPY H1. Ciri-ciri corak: Garisan bawah corak mempunyai koordinat 145.09 dengan had atas 145.09/144.24, unjuran lebar adalah 134 mata. Pembentukan corak Triple Bottom
Open chart in a new window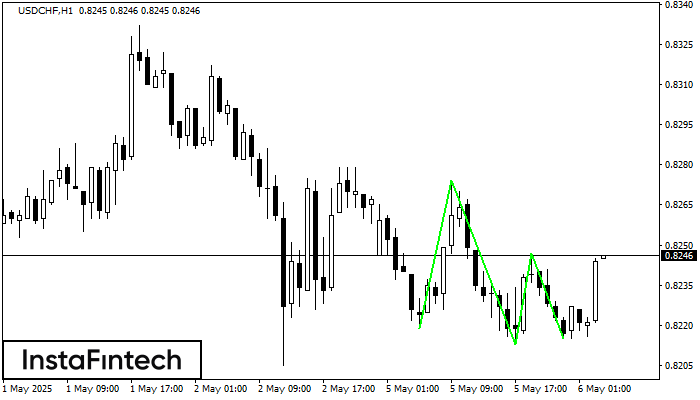
Corak Triple Bottom telah dibentuk pada carta bagi instrumen dagangan USDCHF H1. Corak menandakan perubahan aliran dari menurun ke aliran menaik dalam sekiranya penembusan 0.8274/0.8247
Open chart in a new window


