


signal strength 1 of 5

According to the chart of M5, GOLD formed the Bearish Symmetrical Triangle pattern. Description: The lower border is 3314.14/3331.45 and upper border is 3343.45/3331.45. The pattern width is measured on the chart at -2931 pips. The formation of the Bearish Symmetrical Triangle pattern evidently signals a continuation of the downward trend. In other words, if the scenario comes true and GOLD breaches the lower border, the price could continue its move toward 3331.30.
The M5 and M15 time frames may have more false entry points.
- All
- Double Top
- Flag
- Head and Shoulders
- Pennant
- Rectangle
- Triangle
- Triple top
- All
- #AAPL
- #AMZN
- #Bitcoin
- #EBAY
- #FB
- #GOOG
- #INTC
- #KO
- #MA
- #MCD
- #MSFT
- #NTDOY
- #PEP
- #TSLA
- #TWTR
- AUDCAD
- AUDCHF
- AUDJPY
- AUDUSD
- EURCAD
- EURCHF
- EURGBP
- EURJPY
- EURNZD
- EURRUB
- EURUSD
- GBPAUD
- GBPCHF
- GBPJPY
- GBPUSD
- GOLD
- NZDCAD
- NZDCHF
- NZDJPY
- NZDUSD
- SILVER
- USDCAD
- USDCHF
- USDJPY
- USDRUB
- All
- M5
- M15
- M30
- H1
- D1
- All
- Buy
- Sale
- All
- 1
- 2
- 3
- 4
- 5
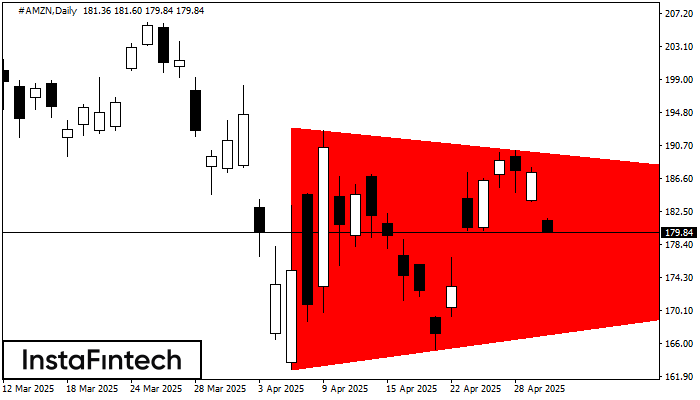
According to the chart of D1, #AMZN formed the Bearish Symmetrical Triangle pattern. This pattern signals a further downward trend in case the lower border 162.77 is breached. Here
Open chart in a new window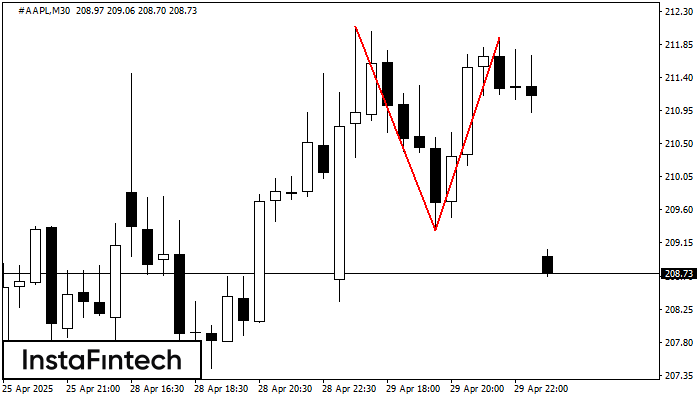
The Double Top pattern has been formed on #AAPL M30. It signals that the trend has been changed from upwards to downwards. Probably, if the base of the pattern 209.32
Open chart in a new window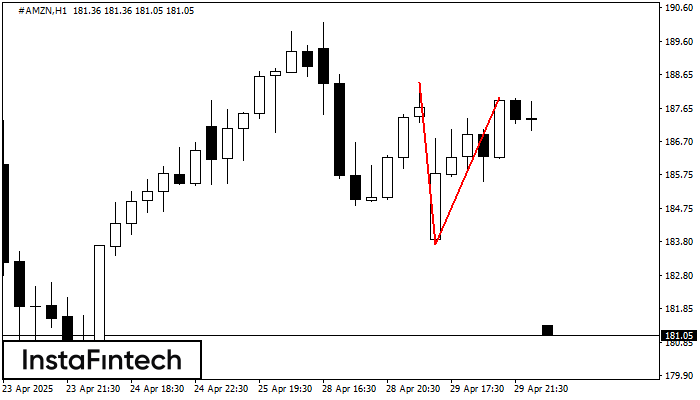
The Double Top reversal pattern has been formed on #AMZN H1. Characteristics: the upper boundary 188.42; the lower boundary 183.71; the width of the pattern is 426 points. Sell trades
Open chart in a new window


