empty
12.02.2025 11:09 AM
Jerome Powell Fails to Impress Markets

This image is no longer relevant

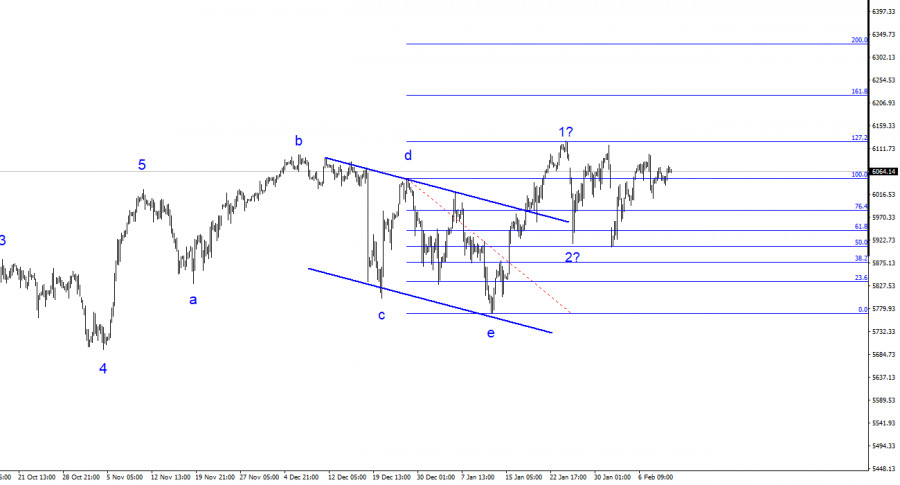
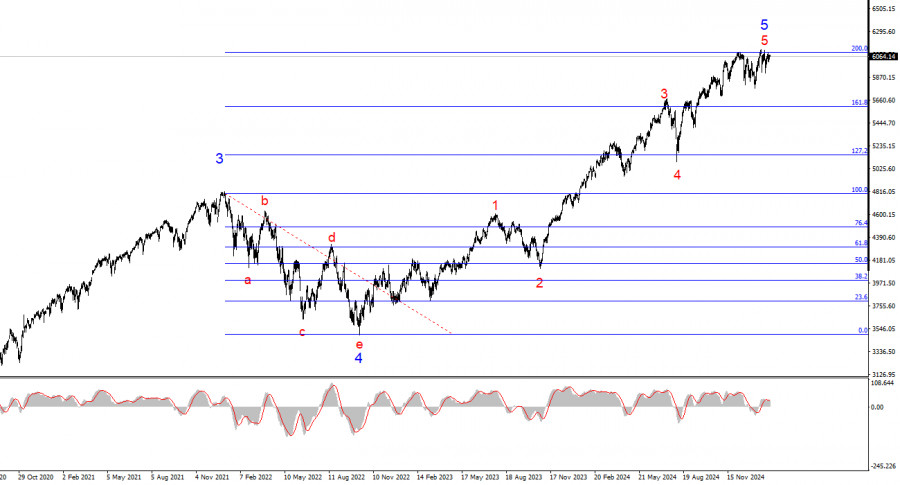
The wave analysis of the 4-hour SPX chart remains ambiguous. On the daily chart, a global five-wave structure is evident, extending beyond even the smallest zoom scale of the trading terminal. In simple terms, U.S. stock indices have been rising for a very long time. But as we know, trends eventually reverse.

Currently, Wave 5 within Wave 5 is still forming. The S&P 500 (#SPX) has attempted three times to break the 6,093 level, which coincides with the 200.0% Fibonacci extension of Wave 4. A correction or a series of corrective waves is likely soon. The U.S. stock market appears overheated, and more experts are warning of a potential "bubble."

A completed a-b-c-d-e corrective structure is visible. The trend from January 13 appeared to form a new five-wave impulse, with Waves 1 and 2 completed. However, Monday's decline disrupted this structure, making it unclear and unreliable. The daily chart structure is more reliable and should be prioritized. Wave analysis must be clear and straightforward—complex structures are harder to trade profitably.

The #SPX remains near record highs, with investors unwilling to sell major U.S. stocks. The uptrend started nearly two years ago, fueled by slowing U.S. inflation and expectations of Fed rate cuts. The rate-cut narrative has been in play for months. The stock market has already factored in Fed easing expectations. Further stock gains may be limited, as the Fed is still hesitant to cut rates aggressively.

Fed Chair Jerome Powell testified before the Senate in a semi-annual hearing. His prepared remarks were published last week, but Monday's session focused on Q&A from senators.

Key messages from Powell are the following. Monetary policy is far less restrictive than before. The U.S. economy remains strong, allowing the Fed to delay rate cuts. A rapid or aggressive rate cut could hinder disinflation. A slow or minimal rate cut could weaken economic activity and employment. The Fed bases rate decisions on all incoming data. Inflation remains elevated, meaning the Fed is not ready to shift to a more dovish stance anytime soon. If the economy remains strong, restrictive policy will stay in place longer. The Fed will only resume rate cuts if the labor market weakens sharply or inflation declines significantly faster than expected.

This image is no longer relevant

General conclusions

Based on #SPX analysis, the index appears to be in the final stages of its uptrend. Short-term trading should be guided by the 6,093 level and Trump's trade policies. Trump's recent trade decisions (tariffs, import restrictions) pose risks to U.S. economic stability. Stock market bubbles continue to inflate, increasing the risk of a significant correction.

The 4-hour chart allows room for three more upward waves. However, the daily chart suggests that the rally is nearing completion. I place more trust in the daily timeframe, which signals a reversal is coming.

A clear five-wave structure is evident on the larger timeframe. Wave 5 appears to be nearing its completion. A prolonged and complex correction is likely on the horizon.

Key Principles of My Wave Analysis:

  1. Wave structures should be simple and clear. Overly complex patterns often lead to misinterpretation and unreliable trades.
  2. If market conditions are unclear, it is best to stay out.
  3. Absolute certainty in market direction is impossible. Always use Stop Loss orders to manage risk effectively.
  4. Wave analysis should be combined with other technical and fundamental tools. Diverse strategies lead to more informed trading decisions.
Chin Zhao,
Analytical expert of InstaForex
© 2007-2025
Select timeframe
5
min
15
min
30
min
1
hour
4
hours
1
day
1
week
Earn on cryptocurrency rate changes with InstaForex
Download MetaTrader 4 and open your first trade
  • Grand Choice
    Contest by
    InstaForex
    InstaForex always strives to help you
    fulfill your biggest dreams.
    JOIN CONTEST

Recommended Stories

US stock market in uptrend as ceasefire announced between Israel and Iran

S&P500 Snapshot of the benchmark US stock indices on Monday: Dow +0.9%, NASDAQ +0.9%, S&P 500 +1%, S&P 500 at 6,025, range 5,600–6,200 In the early hours of June

Jozef Kovach 12:37 2025-06-24 UTC+2

Update on US stock indices on June 24. SP500 and NASDAQ surge amid good news

US stock indices closed higher yesterday. The S&P 500 rose by 0.94%, and the Nasdaq 100 also gained 0.94%. The industrial Dow Jones strengthened by 0.88%. Oil prices fell while

Jakub Novak 10:54 2025-06-24 UTC+2

S&P 500 Forecast for June 24, 2025

S&P 500 The new week began with confident growth for the S&P 500. The support from the balance line indicator (the red moving average) on the weekly timeframe worked well

Laurie Bailey 04:44 2025-06-24 UTC+2

Update on US stock market on June 23. US stock indices close mixed. Oil trades higher amid geopolitical tensions

Last Friday, US stock indices closed mixed. The S&P 500 fell by 0.22%, and the Nasdaq 100 lost 0.55%, while the industrial Dow Jones gained 0.08%. Today, futures for European

Jakub Novak 11:09 2025-06-23 UTC+2

Uptrend in US stock market about to crack. Will market maintain bullish momentum until end of summer?

The US stock market maintains an appearance of stability, but the foundation beneath this calm may prove fragile. Indices remain near historic highs. Nonetheless, a potentially explosive combination is brewing

Anna Zotova 17:09 2025-06-20 UTC+2

Update on US stock market on June 20. SP500 and NASDAQ open with gains

Yesterday, US financial markets were closed. US stock indices ended the electronic trade mixed: the S&P 500 slipped by 0.03%, the Nasdaq 100 gained 0.13%, and the Dow Jones Industrial

Jakub Novak 11:54 2025-06-20 UTC+2

S&P 500 Forecast for June 20, 2025

For the past six weeks, the price has been unsuccessful in testing the resistance of the MACD indicator line on the weekly chart. However, the recent consolidation above the 5908

Laurie Bailey 07:16 2025-06-20 UTC+2

Calm above, crisis below: markets weigh oil, inflation, and Middle East risks

The US stock market is showing mixed performance, reflecting investors' ambivalent outlook after the holiday break. In the latest trading session, the S&P 500 slipped 0.03%, while the Nasdaq rose

Anna Zotova 13:29 2025-06-19 UTC+2

Update on US market on June 19. Federal Reserve downgrades its economic outlook. Stock market awaits correction

S&P500 Snapshot of major US stock indices on Wednesday Dow -0.1%, NASDAQ +0.1%, S&P 500 -0.1%, the S&P 500 closed yesterday at 5,981 trading within the range of 5,600

Jozef Kovach 12:43 2025-06-19 UTC+2

Stock Market as of May 19th: S&P 500 and NASDAQ Decline After Fed Meeting

At the end of the previous regular session, U.S. stock indices closed mixed. The S&P 500 fell by 0.03%, while the Nasdaq 100 rose by 0.13%. The Dow Jones Industrial

Jakub Novak 10:54 2025-06-19 UTC+2
Can't speak right now?
Ask your question in the chat.
Widget callback
 

Dear visitor,

Your IP address shows that you are currently located in the USA. If you are a resident of the United States, you are prohibited from using the services of InstaFintech Group including online trading, online transfers, deposit/withdrawal of funds, etc.

If you think you are seeing this message by mistake and your location is not the US, kindly proceed to the website. Otherwise, you must leave the website in order to comply with government restrictions.

Why does your IP address show your location as the USA?

  • - you are using a VPN provided by a hosting company based in the United States;
  • - your IP does not have proper WHOIS records;
  • - an error occurred in the WHOIS geolocation database.

Please confirm whether you are a US resident or not by clicking the relevant button below. If you choose the wrong option, being a US resident, you will not be able to open an account with InstaForex anyway.

We are sorry for any inconvenience caused by this message.