empty
05.01.2024 11:44 AM
Technical Analysis of GBP/USD for January 5, 2024

GBP/USD Technical Analysis: Navigating Market Uncertainty

Top Insights:

  1. Short-term Bearish Reversal: The GBP/USD pair shows signs of a bearish reversal, marked by a Bearish Engulfing pattern.
  2. Bullish Long-Term Outlook: Despite short-term fluctuations, long-term indicators suggest a bullish trend.
  3. Critical Levels to Monitor: Key support and resistance levels offer insights into potential market movements.

Global Market Context

The Asia-Pacific indices show mixed trends, with China's indices down by about 0.50-0.60% and Japan's Nikkei 225 slightly up by 0.40%. Forex markets remain calm, with most currency pairs showing minimal changes. The USD strengthens, while the JPY weakens, as seen in the USDJPY pair's rise.

This image is no longer relevant

Political Tensions Affecting Markets

Recent events in North Korea, involving artillery shells fired into the sea, add to regional tensions. Such geopolitical factors can influence currency markets, impacting pairs like GBP/USD.

Technical Analysis: A Closer Look

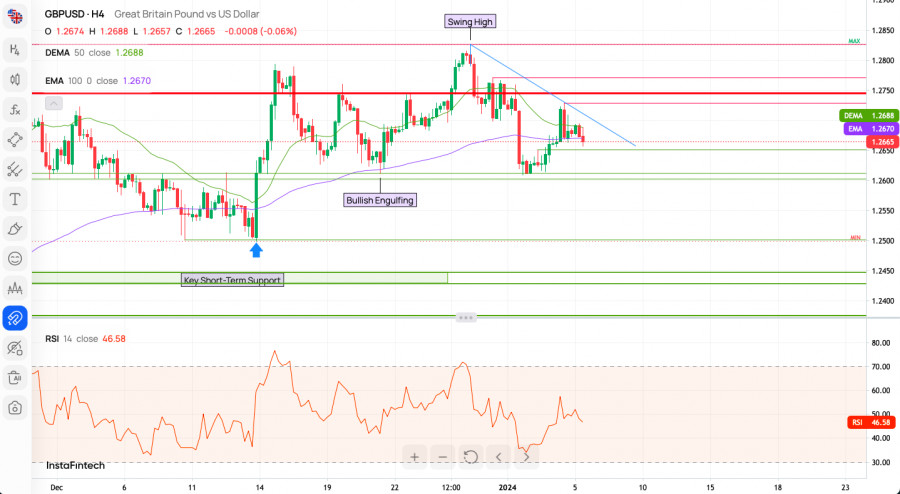
  • Bearish Engulfing Pattern: The GBP/USD pair shows this pattern at the top of its recent move, suggesting a potential downward trend.
  • Support and Resistance: Intraday support lies at 1.2651 and 1.2608, with resistance at 1.2670 and 1.2699.
  • Momentum Analysis: The H4 chart shows weak, negative momentum. A breakout above 1.2699 could shift the outlook back to bullish.

This image is no longer relevant

Indicator Insights

  • Bullish Engulfing Pattern: This pattern, typically a bullish signal, suggests a reversal from a downtrend.
  • Moving Averages: The near overlap of the 50-period DEMA and 100-period EMA, with the DEMA slightly above, is a bullish indicator.
  • RSI Analysis: The RSI at 46.58 indicates a neutral market, without strong buying or selling pressure.

Market Sentiment and Indicator Signals

  • H1 Intraday Indicators: Most indicators show a sell signal, with a few neutral, and one indicating a buy.
  • Sentiment Scoreboard: General sentiment is bullish, with a majority favoring the bulls over the last week and recent days.

Weekly Pivot Points

  • Key Levels: Resistance at WR3 (1.28261) and support at WS3 (1.26053).
  • Trading Focus: Monitoring these levels can provide insights for potential trend reversals or continuations.

Long-Term Trading Perspective

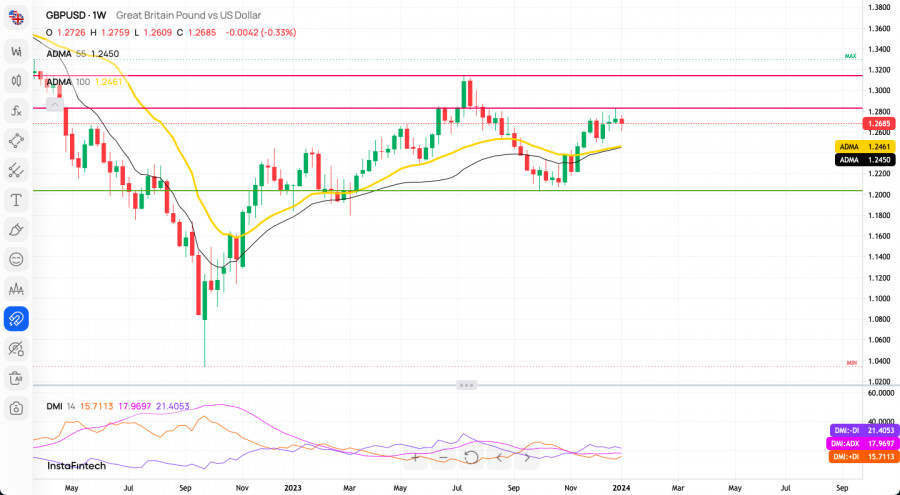
  • Bullish Candlestick Pattern: A decisive Bullish Engulfing pattern on the weekly chart suggests strong bullish sentiment.
  • Market Above WMAs: Trading above the 50 and 100 WMAs underlines the bullish trend, targeting the 2023 high at 1.3141.
  • Critical Support: A sustained break below 1.1802 could signal a major bearish movement.

This image is no longer relevant

Conclusion: A Balanced Approach

For bullish traders, maintaining positions above key support levels aligns with the long-term uptrend. However, bearish traders should watch for breaks below these levels. Always consider both technical and fundamental factors for a comprehensive approach to trading.

Sebastian Seliga,
Especialista em análise na InstaForex
© 2007-2025
Selecionar intervalo de tempo
5
min
15
min
30
min
1
hora
4
horas
1
dia
1
s.
Ganhe com as variações das taxas das criptomoedas com a InstaForex.
Baixe o MetaTrader 4 e abra a sua primeira operação.
  • Grand Choice
    Contest by
    InstaForex
    InstaForex always strives to help you
    fulfill your biggest dreams.
    PARTICIPE DO CONCURSO

Recommended Stories

XAU/USD.Análise e previsão. Situação atual do mercado

Do ponto de vista técnico, o ouro no gráfico de 4 horas estabeleceu aceitação abaixo da Média Móvel Simples (SMA) de 100 períodos, indicando uma potencial continuação do declínio. Além

Irina Yanina 19:41 2025-06-24 UTC+2

Sinais de negociação para OURO (XAU/USD) para 24-28 de junho de 2025: venda abaixo de $3.327 (SMA 21 - 200 EMA)

Esta área de 3.300 representa um forte apoio, mas acreditamos que o ouro poderia fazer uma recuperação técnica nas próximas horas em direção a 3.327. Nesse ponto, ele poderia retomar

Dimitrios Zappas 19:37 2025-06-24 UTC+2

Sinais de negociação para o EUR/USD para 24-28 de junho de 2025: venda abaixo de 1,1620 (topo triplo - 8/8 de Murray)

O gráfico 4H mostra um padrão de formação de topo triplo. Se o preço do euro cair abaixo de 1,1620, o sinal será negativo, e poderemos vender com um alvo

Dimitrios Zappas 19:34 2025-06-24 UTC+2

Será que a correção de enfraquecimento do ouro conseguirá levá-lo ao nível de 3.320 nesta terça-feira, 24 de junho de 2025?

1. Resumo do mercado: Após a forte alta registrada ontem, o ouro passou por uma correção descendente de até -0,39% na manhã de hoje. Esse movimento resulta de uma combinação

Arief Makmur 15:55 2025-06-24 UTC+2

Previsão para o EUR/USD em 24 de junho de 2025

Na segunda-feira, o euro rompeu com sucesso a resistência linear em 1,1535, bem como a linha MACD. Desde a abertura da sessão do Pacífico, o preço manteve uma trajetória

Laurie Bailey 15:15 2025-06-24 UTC+2

Previsão para o GBP/USD em 24 de junho de 2025

GBP/USD Os compradores da libra esterlina superaram com força a pressão dos vendedores, que miravam o alvo em 1,3208. No momento, a resistência da linha MACD, localizada em 1,3570, está

Laurie Bailey 15:12 2025-06-24 UTC+2

Previsão para o USD/JPY em 24 de junho de 2025

USD/JPY O quadro técnico desta segunda-feira pode definir os desdobramentos futuros no médio prazo. A semana começou com um gap de alta, seguido pela formação de uma longa sombra superior

Laurie Bailey 15:09 2025-06-24 UTC+2

Previsão para o EUR/USD em 24 de junho de 2025

Na segunda-feira, o par EUR/USD no gráfico horário apresentou duas recuperações a partir do nível de retração de Fibonacci de 76,4% em 1,1454, reverteu a favor do euro e subiu

Samir Klishi 14:25 2025-06-24 UTC+2

Previsão para o GBP/USD em 24 de junho de 2025

No gráfico horário, o par GBP/USD na segunda-feira se recuperou da zona de suporte de 1,3357–1,3373, reverteu a favor da libra esterlina e se consolidou acima da zona de 1,3425–1,3444

Samir Klishi 14:04 2025-06-24 UTC+2

Sinais de negociação para o EUR/USD para 23-28 de junho de 2025: compre acima de 1,1460 (SMA 21 - 6/8 de Murray)

Por outro lado, esta área em torno da SMA 21, localizada no nível psicológico de 1,15, é fundamental. Abaixo desta área, podemos esperar uma quebra acentuada do canal de tendência

Dimitrios Zappas 17:56 2025-06-23 UTC+2
Não pode falar agora?
Faça sua pergunta no chat.
Widget callback
 

Dear visitor,

Your IP address shows that you are currently located in the USA. If you are a resident of the United States, you are prohibited from using the services of InstaFintech Group including online trading, online transfers, deposit/withdrawal of funds, etc.

If you think you are seeing this message by mistake and your location is not the US, kindly proceed to the website. Otherwise, you must leave the website in order to comply with government restrictions.

Why does your IP address show your location as the USA?

  • - you are using a VPN provided by a hosting company based in the United States;
  • - your IP does not have proper WHOIS records;
  • - an error occurred in the WHOIS geolocation database.

Please confirm whether you are a US resident or not by clicking the relevant button below. If you choose the wrong option, being a US resident, you will not be able to open an account with InstaForex anyway.

We are sorry for any inconvenience caused by this message.