


signal strength 1 of 5
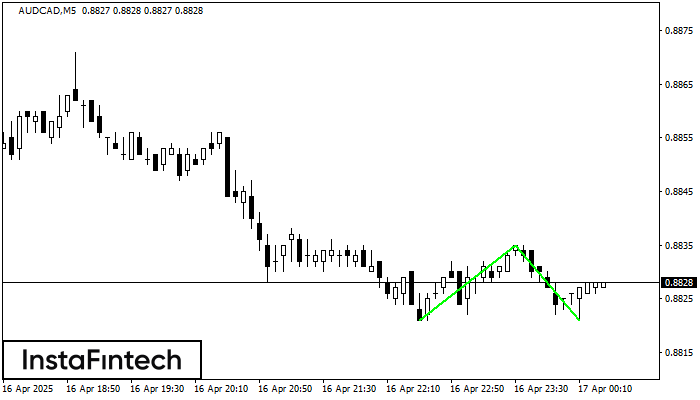
The Double Bottom pattern has been formed on AUDCAD M5; the upper boundary is 0.8835; the lower boundary is 0.8821. The width of the pattern is 14 points. In case of a break of the upper boundary 0.8835, a change in the trend can be predicted where the width of the pattern will coincide with the distance to a possible take profit level.
The M5 and M15 time frames may have more false entry points.
Veja também
- All
- Double Top
- Flag
- Head and Shoulders
- Pennant
- Rectangle
- Triangle
- Triple top
- All
- #AAPL
- #AMZN
- #Bitcoin
- #EBAY
- #FB
- #GOOG
- #INTC
- #KO
- #MA
- #MCD
- #MSFT
- #NTDOY
- #PEP
- #TSLA
- #TWTR
- AUDCAD
- AUDCHF
- AUDJPY
- AUDUSD
- EURCAD
- EURCHF
- EURGBP
- EURJPY
- EURNZD
- EURRUB
- EURUSD
- GBPAUD
- GBPCHF
- GBPJPY
- GBPUSD
- GOLD
- NZDCAD
- NZDCHF
- NZDJPY
- NZDUSD
- SILVER
- USDCAD
- USDCHF
- USDJPY
- USDRUB
- All
- M5
- M15
- M30
- H1
- D1
- All
- Buy
- Sale
- All
- 1
- 2
- 3
- 4
- 5
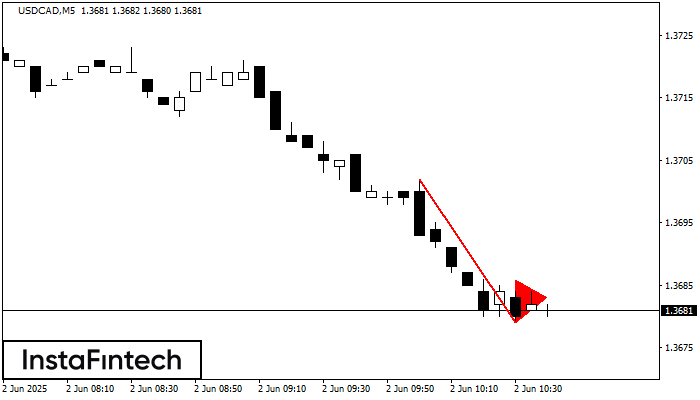
O padrão Pennant de baixa foi formado no gráfico USDCAD M5. Ele sinaliza a continuação potencial da tendência existente. Especificações: o fundo do padrão tem a coordenada de 1.3679;
Os intervalos M5 e M15 podem ter mais pontos de entrada falsos.
Open chart in a new window
De acordo com o gráfico de H1, EURJPY formou o padrão de Triângulo Simétrico de Alta. O limite inferior do padrão toca as coordenadas 162.28/163.37 enquanto o limite superior cruza
Open chart in a new window
O padrão Fundo duplo foi formado em GBPJPY M30. Características: o nível de suporte 193.37; o nível de resistência 194.63; a largura do padrão 126 pontos. Se o nível
Open chart in a new window


