


signal strength 2 of 5

The Triple Top pattern has formed on the chart of the EURUSD M15. Features of the pattern: borders have an ascending angle; the lower line of the pattern has the coordinates 1.1387/1.1391 with the upper limit 1.1397/1.1397; the projection of the width is 10 points. The formation of the Triple Top figure most likely indicates a change in the trend from upward to downward. This means that in the event of a breakdown of the support level of 1.1387, the price is most likely to continue the downward movement.
The M5 and M15 time frames may have more false entry points.
Veja também
- All
- Double Top
- Flag
- Head and Shoulders
- Pennant
- Rectangle
- Triangle
- Triple top
- All
- #AAPL
- #AMZN
- #Bitcoin
- #EBAY
- #FB
- #GOOG
- #INTC
- #KO
- #MA
- #MCD
- #MSFT
- #NTDOY
- #PEP
- #TSLA
- #TWTR
- AUDCAD
- AUDCHF
- AUDJPY
- AUDUSD
- EURCAD
- EURCHF
- EURGBP
- EURJPY
- EURNZD
- EURRUB
- EURUSD
- GBPAUD
- GBPCHF
- GBPJPY
- GBPUSD
- GOLD
- NZDCAD
- NZDCHF
- NZDJPY
- NZDUSD
- SILVER
- USDCAD
- USDCHF
- USDJPY
- USDRUB
- All
- M5
- M15
- M30
- H1
- D1
- All
- Buy
- Sale
- All
- 1
- 2
- 3
- 4
- 5
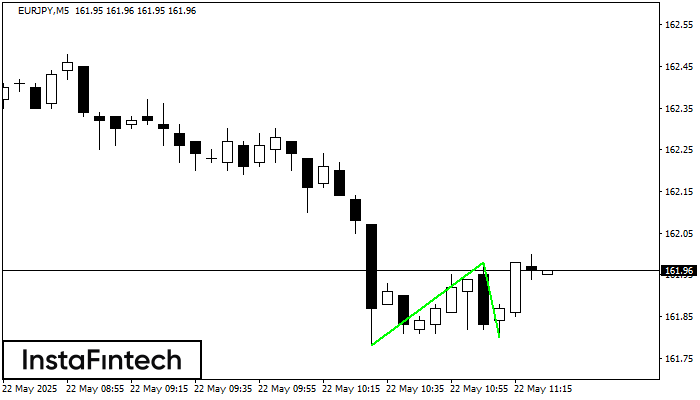
Сформирована фигура «Двойное дно» на графике EURJPY M5. Характеристика: Уровень поддержки 161.78; Уровень сопротивления 161.98; Ширина фигуры 20 пунктов. В случае пробоя уровня сопротивления можно будет прогнозировать изменение тенденции
Таймфреймы М5 и М15 могут иметь больше ложных точек входа.
Открыть график инструмента в новом окне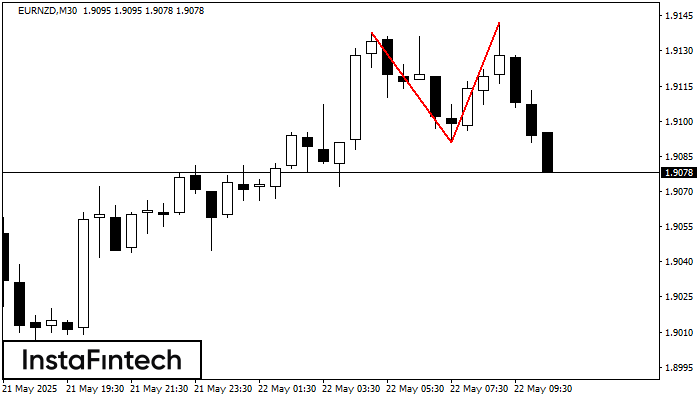
На торговом графике EURNZD M30 сформировалась разворотная фигура «Двойная вершина». Характеристика: Верхняя граница 1.9142; Нижняя граница 1.9091; Ширина фигуры 51 пунктов. Сигнал: Пробой нижней границы 1.9091 приведет к дальнейшему нисходящему
Открыть график инструмента в новом окне
По EURUSD на M30 сформировалась фигура «Бычий симметричный треугольник», которая сигнализирует нам о продолжении тенденции. Характеристика: Верхняя граница фигуры имеет координаты 1.1362/1.1333; Нижняя граница 1.1297/1.1333; Проекция ширины фигуры 65 пунктов
Открыть график инструмента в новом окне


