


signal strength 1 of 5
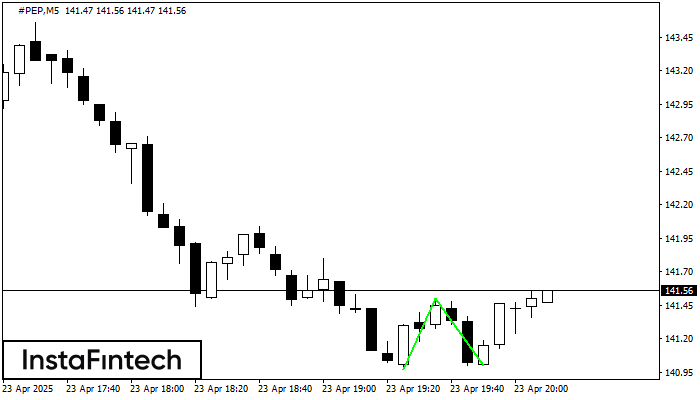
The Double Bottom pattern has been formed on #PEP M5. This formation signals a reversal of the trend from downwards to upwards. The signal is that a buy trade should be opened after the upper boundary of the pattern 141.50 is broken. The further movements will rely on the width of the current pattern 53 points.
The M5 and M15 time frames may have more false entry points.
See Also
- All
- Double Top
- Flag
- Head and Shoulders
- Pennant
- Rectangle
- Triangle
- Triple top
- All
- #AAPL
- #AMZN
- #Bitcoin
- #EBAY
- #FB
- #GOOG
- #INTC
- #KO
- #MA
- #MCD
- #MSFT
- #NTDOY
- #PEP
- #TSLA
- #TWTR
- AUDCAD
- AUDCHF
- AUDJPY
- AUDUSD
- EURCAD
- EURCHF
- EURGBP
- EURJPY
- EURNZD
- EURRUB
- EURUSD
- GBPAUD
- GBPCHF
- GBPJPY
- GBPUSD
- GOLD
- NZDCAD
- NZDCHF
- NZDJPY
- NZDUSD
- SILVER
- USDCAD
- USDCHF
- USDJPY
- USDRUB
- All
- M5
- M15
- M30
- H1
- D1
- All
- Buy
- Sale
- All
- 1
- 2
- 3
- 4
- 5
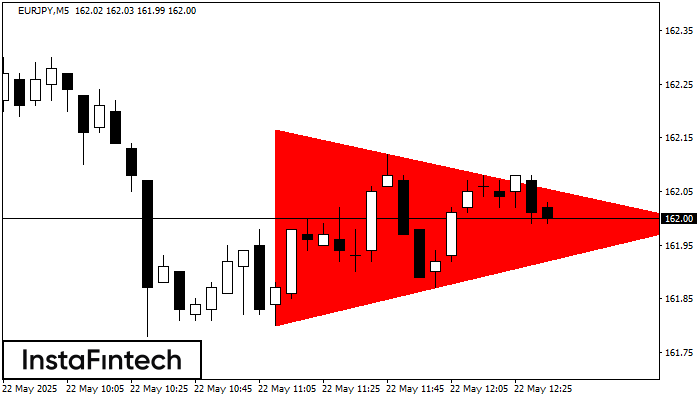
According to the chart of M5, EURJPY formed the Bearish Symmetrical Triangle pattern. Description: The lower border is 161.80/161.99 and upper border is 162.17/161.99. The pattern width is measured
The M5 and M15 time frames may have more false entry points.
Открыть график инструмента в новом окне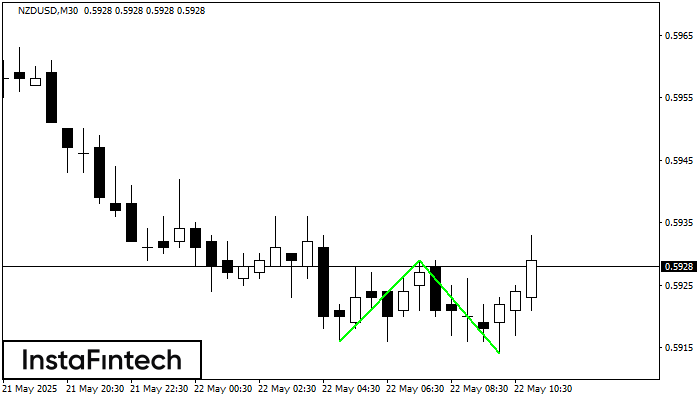
The Double Bottom pattern has been formed on NZDUSD M30. Characteristics: the support level 0.5916; the resistance level 0.5929; the width of the pattern 13 points. If the resistance level
Открыть график инструмента в новом окне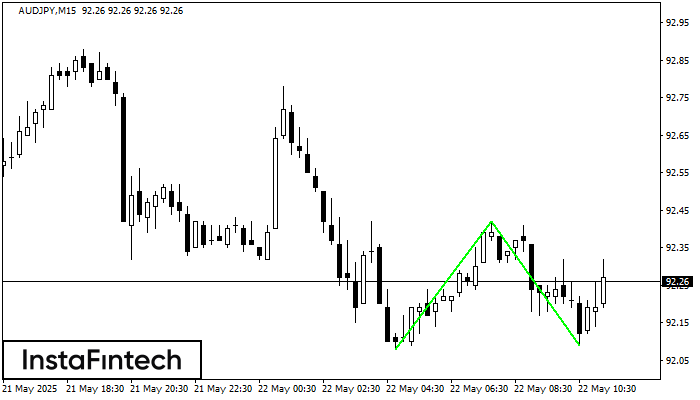
The Double Bottom pattern has been formed on AUDJPY M15. Characteristics: the support level 92.08; the resistance level 92.42; the width of the pattern 34 points. If the resistance level
The M5 and M15 time frames may have more false entry points.
Открыть график инструмента в новом окне


