

signal strength 3 of 5

The Triple Bottom pattern has formed on the chart of the USDJPY M30 trading instrument. The pattern signals a change in the trend from downwards to upwards in the case of breakdown of 141.08/141.05.
- All
- Double Top
- Flag
- Head and Shoulders
- Pennant
- Rectangle
- Triangle
- Triple top
- All
- #AAPL
- #AMZN
- #Bitcoin
- #EBAY
- #FB
- #GOOG
- #INTC
- #KO
- #MA
- #MCD
- #MSFT
- #NTDOY
- #PEP
- #TSLA
- #TWTR
- AUDCAD
- AUDCHF
- AUDJPY
- AUDUSD
- EURCAD
- EURCHF
- EURGBP
- EURJPY
- EURNZD
- EURRUB
- EURUSD
- GBPAUD
- GBPCHF
- GBPJPY
- GBPUSD
- GOLD
- NZDCAD
- NZDCHF
- NZDJPY
- NZDUSD
- SILVER
- USDCAD
- USDCHF
- USDJPY
- USDRUB
- All
- M5
- M15
- M30
- H1
- D1
- All
- Buy
- Sale
- All
- 1
- 2
- 3
- 4
- 5
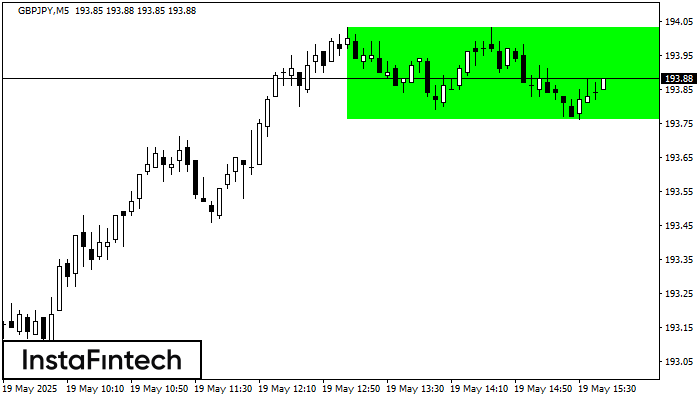
According to the chart of M5, GBPJPY formed the Bullish Rectangle. The pattern indicates a trend continuation. The upper border is 194.03, the lower border is 193.76. The signal means
The M5 and M15 time frames may have more false entry points.
Open chart in a new window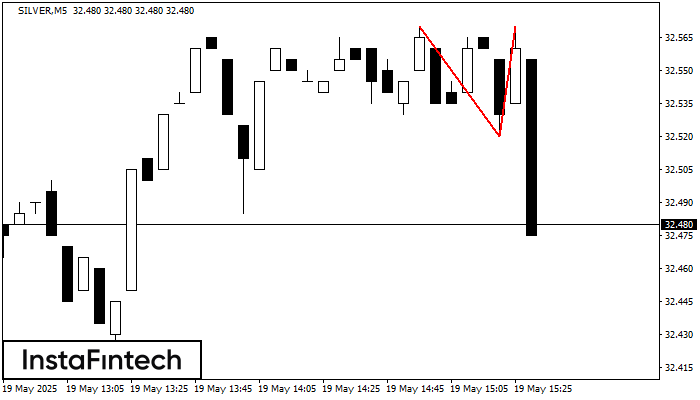
The Double Top pattern has been formed on SILVER M5. It signals that the trend has been changed from upwards to downwards. Probably, if the base of the pattern 32.52
The M5 and M15 time frames may have more false entry points.
Open chart in a new window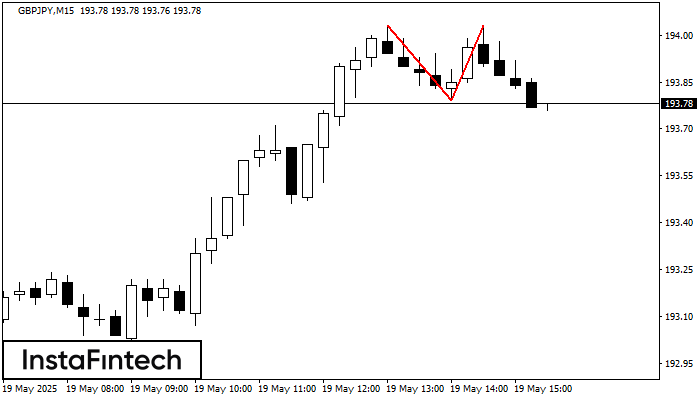
On the chart of GBPJPY M15 the Double Top reversal pattern has been formed. Characteristics: the upper boundary 194.03; the lower boundary 193.79; the width of the pattern 24 points
The M5 and M15 time frames may have more false entry points.
Open chart in a new window


