


signal strength 1 of 5

The Double Top reversal pattern has been formed on #Bitcoin M5. Characteristics: the upper boundary 85455.73; the lower boundary 85324.27; the width of the pattern is 13285 points. Sell trades are better to be opened below the lower boundary 85324.27 with a possible movements towards the 85324.12 level.
The M5 and M15 time frames may have more false entry points.
Vea asimismo
- All
- Double Top
- Flag
- Head and Shoulders
- Pennant
- Rectangle
- Triangle
- Triple top
- All
- #AAPL
- #AMZN
- #Bitcoin
- #EBAY
- #FB
- #GOOG
- #INTC
- #KO
- #MA
- #MCD
- #MSFT
- #NTDOY
- #PEP
- #TSLA
- #TWTR
- AUDCAD
- AUDCHF
- AUDJPY
- AUDUSD
- EURCAD
- EURCHF
- EURGBP
- EURJPY
- EURNZD
- EURRUB
- EURUSD
- GBPAUD
- GBPCHF
- GBPJPY
- GBPUSD
- GOLD
- NZDCAD
- NZDCHF
- NZDJPY
- NZDUSD
- SILVER
- USDCAD
- USDCHF
- USDJPY
- USDRUB
- All
- M5
- M15
- M30
- H1
- D1
- All
- Buy
- Sale
- All
- 1
- 2
- 3
- 4
- 5
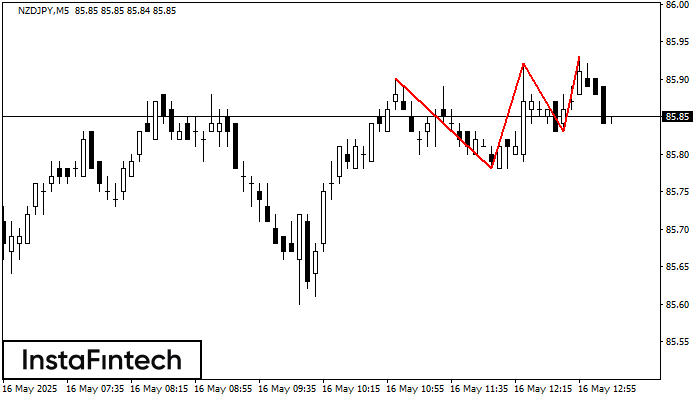
En el gráfico del instrumento de negociación NZDJPY M5, se ha formado el patrón Triple Techo que señala un cambio en la tendencia. Es posible que después de la formación
Los marcos de tiempo M5 y M15 pueden tener más puntos de entrada falsos.
Open chart in a new window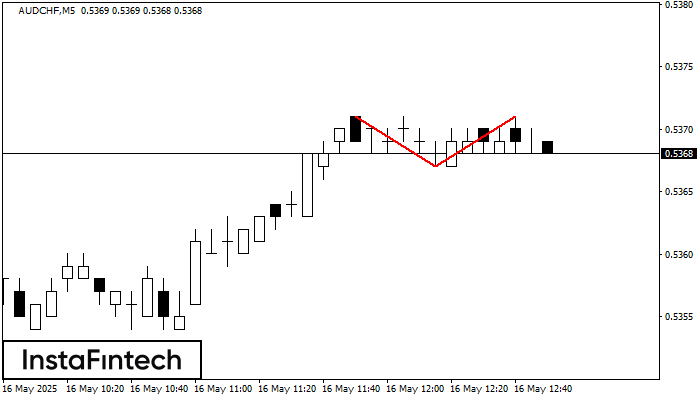
En el gráfico de AUDCHF M5 el patrón de reversión Doble Techo ha sido formado. Características: límite superior 0.5371; límite inferior 0.5367; el ancho del patrón 4 puntos. La señal
Los marcos de tiempo M5 y M15 pueden tener más puntos de entrada falsos.
Open chart in a new window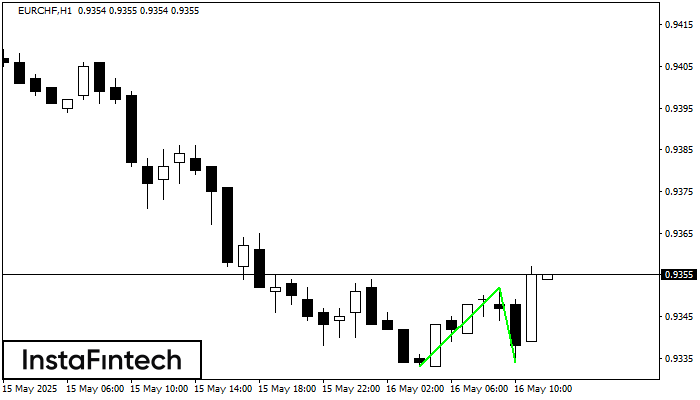
El patrón Doble Piso ha sido formado en EURCHF H1. Características: el nivel de soporte 0.9333; el nivel de resistencia 0.9352; el ancho del patrón 19 puntos. Si el nivel
Open chart in a new window


