empty
09.02.2022 06:12 AM
Trading signals for Crude Oil (WTI - #CL) on February 9-10, 2022

This image is no longer relevant

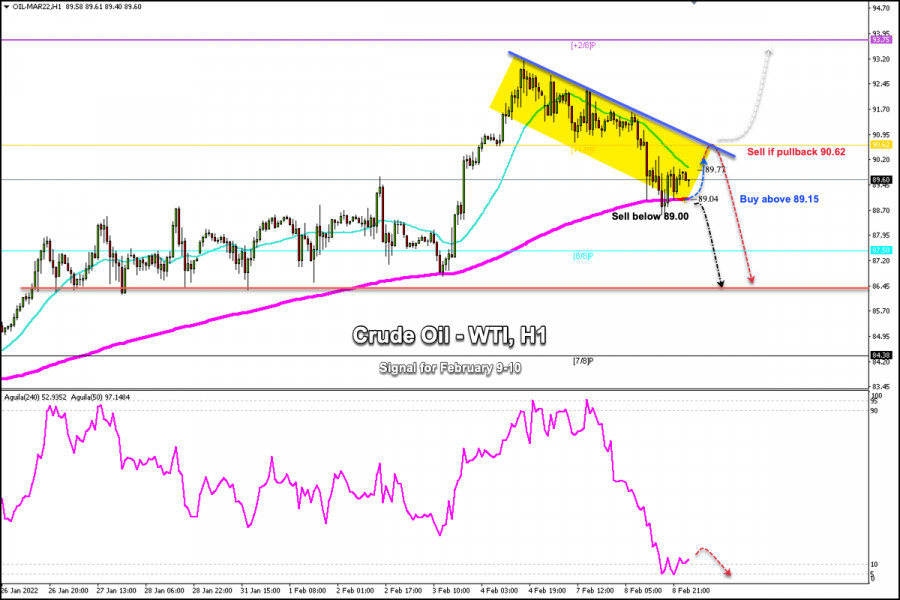
WTI has been falling for the third day in a row. It is currently trading at 89.60 per barrel after reaching an eight-year high of 93.15.

WTI finds support due to the developments in the tensions on the border between Russia and Ukraine, if this continues it could limit the supply of oil.

On the other hand, there are doubts about the production increase of 400,000 barrels by the Organization of the Petroleum Exporting Countries and its allies (OPEC+). The OPEC+ countries, led by Russia and Saudi Arabia, are only gradually increasing production.

Investors are anticipating the release of US consumer inflation figures on Thursday. The US CPI report will influence the Fed's monetary policy decision and help determine the next move in Crude Oil which is correlated to Wall Street indices.

On the H1 chart, WTI has found support around 89.00. A technical bounce above this level could give us an opportunity to buy to the top of the downtrend channel around 90.62.

On the other hand, a pullback towards the resistance +1/8 Murray around 90.62 will be an opportunity to sell with targets at 89.00 until 8/8 Murray around 87.50.

Conversely, if crude oil fails to consolidate above the 200 EMA (89.00) bearish pressure is likely to continue and there may be an acceleration of the decline towards 87.50 and key support at 86.45.

The eagle indicator has reached the oversold zone and a technical rebound is expected in the next few hours to resume the downtrend.

Our trading plan for the next few hours is drawn on the chart above where you can find the levels to buy or sell according to the movement of the market.

Support and Resistance Levels for February 9 - 10, 2022

Resistance (3) 93.09

Resistance (2) 91.41

Resistance (1) 90.62

----------------------------

Support (1) 88.28

Support (2) 87.50

Support (3) 86.83

***********************************************************


Scenario

Timeframe H1

Recommendation: sell below o if pullback

Entry Point 3,125; 3,335

Take Profit 89.00; 90.62

Stop Loss 89.60; 91.20

Murray Levels 93.75 (+2/8),90.62(+1/8), 87.50 (8/8), 84.38 (7/8)

***************************************************************************

เลือกช่วงเวลา
5
นาที
15
นาที
30
นาที
1
ชั่วโมง
4
ชั่วโมง
1
วัน
1
สัปดาห์
รับผลกำไรจากการเปลี่ยนแปลงอัตราสกุลเงินดิจิทัลกับ InstaForex.
ดาวน์โหลด MetaTrader 4 และเปิดการซื้อขายครั้งแรกของคุณ.
  • Grand Choice
    Contest by
    InstaForex
    InstaForex always strives to help you
    fulfill your biggest dreams.
    เข้าร่วมการแข่งขัน


บทความแนะนำ

ความต้องการในประเทศและราคาที่น่าสนใจ

โครงสร้างคลื่นในกราฟ 24 ชั่วโมงสำหรับเครื่องมือ #SPX ค่อนข้างง่ายต่อการตีความ รูปแบบห้าคลื่นโลกที่ไม่สามารถใส่ในหน้าต่างลงท้ายในระดับที่เล็กที่สุดได้ เนื่องจากตลาดหุ้นสหรัฐได้ขึ้นอย่างยาวนาน ในขณะนี้ ส่วนขึ้นของแนวโน้มดูเหมือนจะเสร็จสิ้น ในความคิดของฉัน เรามีแนวโน้มที่จะเห็นคลื่นแก้ไขที่ยาวนานขึ้น เพราะช่วงคลื่นแก้ไขของแนวโน้มในปัจจุบันไม่ดูน่าเชื่อถือ ฉันอยากจะเห็นโครงสร้างสามหรือห้าคลื่นที่ชัดเจนกว่า ในกราฟ

Chin Zhao 11:56 2025-05-27 UTC+2

อัปเดตตลาดหุ้นวันที่ 27 พฤษภาคม: S&P 500 และ NASDAQ ยังคงมีศักยภาพในการเติบโต

หลังจากช่วงการซื้อขายปกติล่าสุด ดัชนีหุ้นสหรัฐฯ ปิดตลาดในแดนลบ โดย S&P 500 ลดลง 0.67% ส่วน Nasdaq 100 ลดลง 1.00% ด้าน

Jakub Novak 11:08 2025-05-27 UTC+2

อัปเดตเกี่ยวกับตลาดหุ้นสหรัฐในวันที่ 27 พฤษภาคม ตลาดเริ่มฟื้นตัว

S&P500 สรุปภาพรวมดัชนีหุ้นที่สำคัญของสหรัฐในวันจันทร์: Dow: -0%, NASDAQ: -0%, S&P 500: -0%, S&P 500 อยู่ที่ 5802 มีช่วงการซื้อขายระหว่าง 5400–6200

Jozef Kovach 10:40 2025-05-27 UTC+2

ทรัมป์เปลี่ยนวาทศิลป์ ค่าเงินดอลลาร์สหรัฐอ่อนค่าลง

โลกกำลังเปลี่ยนแปลงเร็วกว่าอัตราการเปลี่ยนแปลงของตลาด ดอลลาร์กำลังสูญเสียมูลค่าอย่างรวดเร็วท่ามกลางการพักศึกการค้าระหว่างสหรัฐฯ-สหภาพยุโรป ขณะเดียวกัน Nvidia ถูกบังคับให้ลดราคาผลิตภัณฑ์ AI สำหรับประเทศจีนภายใต้แรงกดดันจากการคว่ำบาตร ส่วน Visa และ Mastercard กำลังเผชิญกับค่าปรับหลายพันล้านยูโรในยุโรป ในขณะเดียวกัน Oracle มีแผนลงทุน

Аlena Ivannitskaya 13:05 2025-05-26 UTC+2

แนวโน้มตลาดหุ้นสำหรับวันที่ 26 พฤษภาคม: S&P 500 และ NASDAQ กลับสู่การเติบโต

ในช่วงก่อนหน้าของการซื้อขายตามปกติ ดัชนีหุ้นสหรัฐฯ ปิดตัวต่ำลง โดย S&P 500 ลดลง 0.67%, Nasdaq 100 ลดลง 1.00%, และ Dow Jones

Jakub Novak 11:50 2025-05-26 UTC+2

อัปเดตตลาดหุ้นสหรัฐ ณ วันที่ 26 พฤษภาคม

S&P500 ตลาดหุ้นสหรัฐฯ กำลังปรับตัวสูงขึ้น สรุปภาพรวมของดัชนีหุ้นหลักในสหรัฐอเมริกาเมื่อวันศุกร์: Dow -0.6%, NASDAQ -1%, S&P 500 -0.7%, S&P 500 อยู่ที่ 5,802

Jozef Kovach 10:35 2025-05-26 UTC+2

คำแนะนำในการซื้อและขายหุ้นสำหรับวันที่ 26 พฤษภาคม 2025

คำแนะนำการซื้อ: Freeport-McMoRan Copper & Gold (#FCX) Freeport-McMoRan เป็นหนึ่งในผู้ผลิตโลหะไม่มีธาตุเหล็กที่ใหญ่ที่สุดในโลก ในกราฟรายวัน การปรับฐานได้เสร็จสิ้นแล้ว โดยราคาทรงตัวอยู่เหนือระดับแนวรับที่ 37.18 และเหนือเส้นดัชนีสมดุล MACD เส้น

Laurie Bailey 06:59 2025-05-26 UTC+2

อัปเดตตลาดหุ้นสหรัฐฯ วันที่ 23 พฤษภาคม การปรับฐานครั้งนี้

ภาพรวมดัชนีหุ้นหลักของสหรัฐฯ วันพฤหัสบดี: Dow -1.4%, NASDAQ +0.3%, S&P 500 0%, S&P 500 ที่ 5,842, ช่วง 5,400–6,200

Jozef Kovach 14:53 2025-05-23 UTC+2

ตลาดใกล้จุดสูงสุด: การพุ่งขึ้นสุดท้ายหรือจะมีการถอยกลับใหม่?

นักลงทุนมีความรู้สึกว่าพื้นฐานที่พวกเขายืนอยู่กำลังเริ่มแตกร้าว ในสัปดาห์นี้ การอนุมัติแพคเกจการเงินขนาดใหญ่ของรัฐบาล Trump ซึ่งรวมถึงคำมั่นสัญญาการลดภาษีและการใช้จ่ายทางทหารที่เพิ่มขึ้น ได้กระตุ้นทั้งนักลงทุนที่มองในแง่ดีและผู้ที่มองแบบระมัดระวัง สำนักงานงบประมาณรัฐสภาประเมินว่าค่าใช้จ่ายของโครงการเหล่านี้อยู่ที่ 4 ล้านล้านดอลลาร์ และสิ่งนี้ไม่ได้ถูกมองข้าม Moody's ได้ลดอันดับเครดิตของสหรัฐฯ ลงมาอยู่ที่ Aa1 ตลาดมีการตอบสนองที่ไม่แน่นอน

Anna Zotova 13:05 2025-05-23 UTC+2

การคาดการณ์ S&P 500 สำหรับวันที่ 23 พฤษภาคม 2025

ในกรอบเวลารายวัน ราคากำลังรวมตัวอยู่ใต้เส้นสีเขียวของช่องทางราคาที่มีแนวโน้มสูงขึ้น โดยมีระดับเป้าหมายที่ 5908 ซึ่งมีแนวโน้มบ่งชี้ถึงการเตรียมพร้อมที่จะทะลุด่านแนวต้าน มุ่งสู่การเติบโตอย่างต่อเนื่องไปยังขอบบนของช่องทางราคาที่ประมาณ 6318 เส้นสัญญาณของ Marlin oscillator ยังคงลดลงอยู่ ดังนั้นเรายังไม่รีบร้อน แต่กำลังเตรียมตัวสำหรับสถานการณ์ที่ตลาดจะเป็นเชิงบวก บนกราฟสี่ชั่วโมง สัญญาณสำคัญสำหรับการกลับแนวโน้มขึ้นคือเส้นสัญญาณของ

Laurie Bailey 05:16 2025-05-23 UTC+2
หากไม่สะดวกคุยในตอนนี้
ระบุคำถามไว้ได้ใน แชท.
Widget callback
 

Dear visitor,

Your IP address shows that you are currently located in the USA. If you are a resident of the United States, you are prohibited from using the services of InstaFintech Group including online trading, online transfers, deposit/withdrawal of funds, etc.

If you think you are seeing this message by mistake and your location is not the US, kindly proceed to the website. Otherwise, you must leave the website in order to comply with government restrictions.

Why does your IP address show your location as the USA?

  • - you are using a VPN provided by a hosting company based in the United States;
  • - your IP does not have proper WHOIS records;
  • - an error occurred in the WHOIS geolocation database.

Please confirm whether you are a US resident or not by clicking the relevant button below. If you choose the wrong option, being a US resident, you will not be able to open an account with InstaForex anyway.

We are sorry for any inconvenience caused by this message.