empty
14.04.2023 12:52 AM
Technical analysis of GBP/USD for April 13, 2023

This image is no longer relevant

Overview :

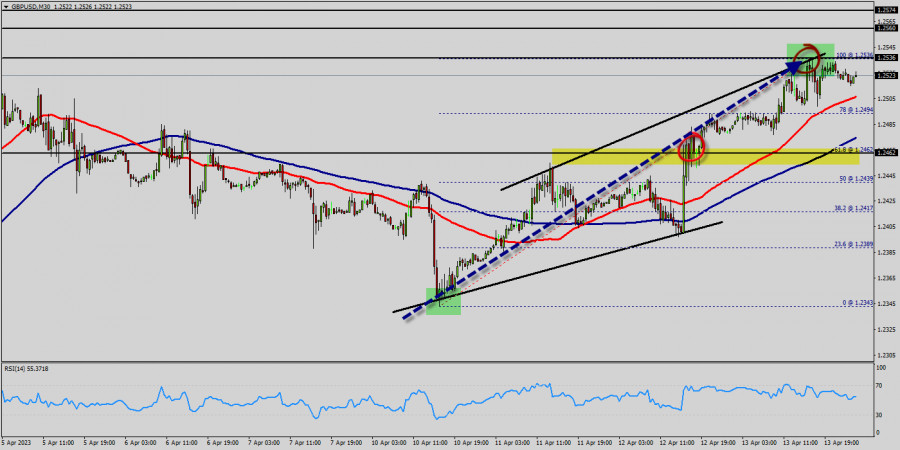
The GBPUSD pair traded with strong positivity yesterday to return to the bullish channel that appears on the chart, to head towards achieving expected additional gains in the upcoming sessions, targeting visiting 1.2522 level mainly. Therefore, we expect to witness more bullish bias in the upcoming sessions, noting that breaking 1.2462 and holding above it will stop the positive scenario and push the price to decline again.

The expected trading range for today is between 1.2462 support and 1.2560 resistance. The GBP/USD pair is going to continue to rise from the level of 1.2462 in the long term.

It should be noted that the support is established at the level of 1.2462 which represents the 61.8% Fibonacci retracement level on the M30 chart. The price is likely to form a double bottom in the same time frame. Accordingly, the GBP/USD pair is showing signs of strength following a breakout of the highest level of 1.2462.

So, buy above the level of 1.2462 with the first target at 1.2536 in order to test the daily resistance 1; and further to 1.2560.

Also, it might be noted that the level of 1.2560 is a good place to take profit because it will form a double top. The price is in a bullish channel now. In the Forex market, liquidity pertains to a currency pair's ability to be bought and sold at the current market price. Additionally, liquidity refers to market volatility and dynamics. Because the Forex market is colossal, it is also extremely liquid. Moreover, if a currency pair has high level of liquidity, it will be easier to trade.

On the other hand, in case a reversal takes place and the GBP/USD pair breaks through the support level of 1.2462, a further decline to 1.2343 can occur which would indicate a bearish market.

Trading recommendations :

The trend is still bullish as long as the price of 1.2463 is not broken. Thereupon, it would be wise to buy above the price of at 1.2463 with the primary target at 1.2536. Then, the GBP/USD pair will continue towards the second target at 1.2560.

In technical analysis: history usually repeats itself at certain level. So it will be of the wisdom to use historic rates to determine future prices. The technical analysis based only on the technical market data (quotes) with the help of various technical indicators. Moreover, in this book we will be touching on a variety of new techniques for applying numerical strategies, equations, formulas and probabilities. Additionally, we will be shared some of classical analysis such as breakout strategy and trend indicators. Alternative scenario : The breakdown of 1.2463 will allow the pair to go further down to the prices of 1.2403 and 1.2343.

เลือกช่วงเวลา
5
นาที
15
นาที
30
นาที
1
ชั่วโมง
4
ชั่วโมง
1
วัน
1
สัปดาห์
รับผลกำไรจากการเปลี่ยนแปลงอัตราสกุลเงินดิจิทัลกับ InstaForex.
ดาวน์โหลด MetaTrader 4 และเปิดการซื้อขายครั้งแรกของคุณ.
  • Grand Choice
    Contest by
    InstaForex
    InstaForex always strives to help you
    fulfill your biggest dreams.
    เข้าร่วมการแข่งขัน


บทความแนะนำ

สัญญาณการเทรดสำหรับ EUR/USD สำหรับวันที่ 2-5 เมษายน 2025: ขายต่ำกว่า 1.0815 (21 SMA - +1/8 Murray)

หากยูโรทะลุและสามารถปรับฐานเหนือช่องแนวโน้มขาลงได้ เราอาจคาดว่ามันจะไปถึง +1/8 ระดับ Murray ที่ 1.0864 ในอีกไม่กี่วันข้างหน้า EUR/USD อาจไปถึง +2/8 ระดับ Murray ซึ่งตั้งอยู่ที่ 1.0986

Dimitrios Zappas 15:18 2025-04-02 UTC+2

สัญญาณการซื้อขายสำหรับทองคำ (XAU/USD) ระหว่างวันที่ 2-5 เมษายน 2025: ขายเมื่อราคาต่ำกว่า $3,140 หรือซื้อเมื่อราคาสูงกว่า $3,110 (21 SMA - สามเหลี่ยมสมมาตร)

ในช่วงต้นของการซื้อขายในตลาดอเมริกา ราคาทองคำซื้อขายอยู่ที่ประมาณ 3,122 ซึ่งสูงกว่า 21 SMA และอยู่ภายในรูปแบบสามเหลี่ยมสมมาตรที่เกิดจากราคาสูงสุดตลอดกาลที่ 3,149 การซื้อขายในช่วงไม่นานมานี้บ่งบอกว่าทองคำกำลังเตรียมพร้อมสำหรับเหตุการณ์สำคัญที่สุดของสัปดาห์นี้: การรายงานตัวเลขการจ้างงานนอกภาคเกษตรของสหรัฐฯ ซึ่งจะประกาศในวันศุกร์ เราเชื่อว่ารายงานนี้อาจช่วยสนับสนุนราคาทองคำ และราคาอาจเพิ่มขึ้นถึง 3,169 หรือแม้แต่

Dimitrios Zappas 15:15 2025-04-02 UTC+2

พยากรณ์ฟอเร็กซ์ 02/04/2025: EUR/USD, USD/JPY, USDX และ Bitcoin

ลิงก์ที่มีประโยชน์: บทความอื่น ๆ ของฉันมีให้ในส่วนนี้ คอร์ส InstaForex สำหรับผู้เริ่มต้น การวิเคราะห์ที่ได้รับความนิยม เปิดบัญชีการซื้อขาย ที่สำคัญ: ผู้เริ่มต้นในการซื้อขายฟอเร็กซ์ควรให้ความระมัดระวังอย่างมากในการตัดสินใจเกี่ยวกับการเข้าสู่ตลาด ก่อนการประกาศรายงานที่สำคัญ ควรหลีกเลี่ยงการเข้าสู่ตลาดเพื่อป้องกันการถูกพัลวันไปกับความผันผวนของตลาดที่เพิ่มขึ้น หากคุณตัดสินใจซื้อขายระหว่างการประกาศข่าว ควรวางคำสั่งหยุดทุกครั้งเพื่อป้องกันความเสี่ยงจากการสูญเสียเงินลงทุน

Sebastian Seliga 11:34 2025-04-02 UTC+2

แนวโน้มของ EUR/USD ในวันที่ 2 เมษายน 2025

เมื่อวันอังคาร คู่เงิน EUR/USD ฟื้นตัวจากโซนแนวรับที่ระดับ 1.0781–1.0797 แต่ไม่สามารถขึ้นไปถึงระดับ Fibonacci 200.0% ที่ 1.0857 ได้ ในเช้าวันพุธ คู่เงินกลับมาที่โซนระดับ 1.0781–1.0797 การฟื้นตัวจากโซนนี้อาจนำไปสู่การเคลื่อนไหวขึ้นบ้าง

Samir Klishi 11:23 2025-04-02 UTC+2

การพยากรณ์ GBP/USD ในวันที่ 2 เมษายน 2025

ในกราฟรายชั่วโมง คู่เงิน GBP/USD ยังคงเคลื่อนไหวไปมาในทิศทางด้านข้างเมื่อวันอังคารที่ผ่านมา ขณะนี้ยังไม่มีการครอบงำของทั้งฝั่งกระทิงหรือหมีในตลาด—and this has been the case for a full month. ระดับ

Samir Klishi 11:17 2025-04-02 UTC+2

การคาดการณ์ EUR/USD ประจำวันที่ 2 เมษายน 2025

ถึงสิ้นวานนี้ ยูโรปรับตัวลง 25 จุด แต่อย่างไรก็ดี ค่าเสี่ยงในตลาดยังคงเติบโต: ดัชนี S&P 500 ขึ้น 0.38% อัตราผลตอบแทนของพันธบัตรรัฐบาลสหรัฐฯ 5 ปี ยังคงที่เป็นวันที่สามที่

Laurie Bailey 04:49 2025-04-02 UTC+2

การคาดการณ์ GBP/USD สำหรับวันที่ 2 เมษายน 2025

ข้อมูลเมื่อวานนี้เกี่ยวกับกิจกรรมการผลิตของอังกฤษในเดือนมีนาคมแสดงให้เห็นถึงการลดลงจาก 46.9 เป็น 44.9 เมื่อตั้งฉากกับดัชนีของสหรัฐฯ ที่ลดลงจาก 52.7 เป็น 50.2 การลดลงของดัชนีอังกฤษดูน่าผิดหวัง — โดยเฉพาะอย่างยิ่งเนื่องจากนี่คือตัวเลขที่ต่ำที่สุดตั้งแต่เดือนตุลาคม 2023 นักลงทุนจึงเทขายเงินปอนด์เล็กน้อย แต่ภายในสิ้นวัน

Laurie Bailey 04:49 2025-04-02 UTC+2

การคาดการณ์ราคาบิตคอยน์สำหรับวันที่ 2 เมษายน 2025

Bitcoin (BTC) หลังจากถึงระดับแนวรับที่ 81,231 (จุดต่ำสุดโดยประมาณจากวันที่ 4 และ 18 มีนาคม) ราคาก็เข้าใกล้เส้น MACD (86,038) การฝ่าเส้นนี้ขึ้นไปได้จะช่วยให้ราคามีโอกาสเติบโตต่อไปสู่ระดับเป้าหมายถัดไปที่ 90,873 และต่อจากนั้นที่

Laurie Bailey 04:49 2025-04-02 UTC+2

สัญญาณการซื้อขายสำหรับ EUR/USD ระหว่างวันที่ 1-3 เมษายน 2025: ขายต่ำกว่า 1.0804 (21 SMA - 8/8 Murray)

ในช่วงต้นของการซื้อขายฝั่งอเมริกา ยูโรกำลังเคลื่อนไหวอยู่ที่ประมาณ 1.0791 มีการปรับแก้ทางเทคนิคหลังจากขึ้นไปถึงยอดของช่องแนวโน้มขาลงที่ก่อตัวในวันที่ 14 มีนาคม และแสดงสัญญาณของการอ่อนแรง ยูโรมีความลำบากในการปรับตัวขึ้นต่อและขณะนี้กำลังซื้อขายต่ำกว่าค่าเฉลี่ยเคลื่อนที่ 21 วัน (21SMA) ซึ่งบ่งชี้ว่าการปรับแก้ทางเทคนิคอาจดำเนินต่อไปในอีกไม่กี่ชั่วโมงข้างหน้า ดังนั้น EUR/USD อาจแตะที่

Dimitrios Zappas 15:06 2025-04-01 UTC+2

สัญญาณการซื้อขายสำหรับทองคำ (XAU/USD) วันที่ 1-3 เมษายน 2025: ขายต่ำกว่า $3,144 (21 SMA - 8/8 Murray)

ในทางตรงกันข้าม หากราคาเคลื่อนตัวอยู่ต่ำกว่าระดับ 8/8 Murray ที่ 3,125 ทิศทางจะเป็นเชิงลบ ดังนั้น เราเชื่อว่าเครื่องมือทางการเงินนี้อาจลดลงไปถึง 3,091 ในระยะสั้นและในที่สุดอาจกลับขึ้นไปถึงระดับ 7/8 Murray ที่ 3,046

Dimitrios Zappas 15:04 2025-04-01 UTC+2
หากไม่สะดวกคุยในตอนนี้
ระบุคำถามไว้ได้ใน แชท.
Widget callback
 

Dear visitor,

Your IP address shows that you are currently located in the USA. If you are a resident of the United States, you are prohibited from using the services of InstaFintech Group including online trading, online transfers, deposit/withdrawal of funds, etc.

If you think you are seeing this message by mistake and your location is not the US, kindly proceed to the website. Otherwise, you must leave the website in order to comply with government restrictions.

Why does your IP address show your location as the USA?

  • - you are using a VPN provided by a hosting company based in the United States;
  • - your IP does not have proper WHOIS records;
  • - an error occurred in the WHOIS geolocation database.

Please confirm whether you are a US resident or not by clicking the relevant button below. If you choose the wrong option, being a US resident, you will not be able to open an account with InstaForex anyway.

We are sorry for any inconvenience caused by this message.