empty
03.11.2023 06:46 AM
EUR/USD and GBP/USD: Technical analysis for November 3

EUR/USD

This image is no longer relevant

Higher Timeframes

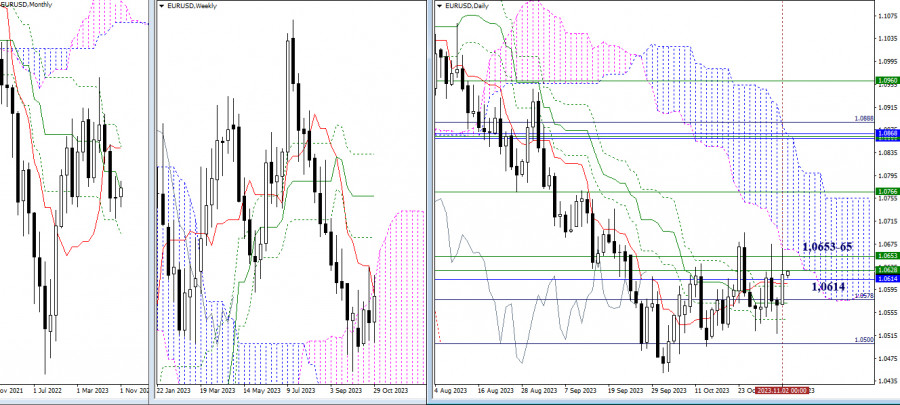
Bulls continue to make efforts and strive to achieve results. The obstacles in their path are currently concentrated in the resistance zone of 1.0614 - 1.0628 - 1.0653 - 1.0665 (monthly medium-term trend + weekly levels + the lower boundary of the daily cloud). Breaking through these boundaries is the first step towards new prospects and opportunities. The next upward target in the current situation can be marked at the level of 1.0766 (weekly Fibonacci Kijun). Meanwhile, for bears, it remains important to overcome the supports at 1.0500 - 1.0449 and restore the downward trend.

This image is no longer relevant

H4 - H1

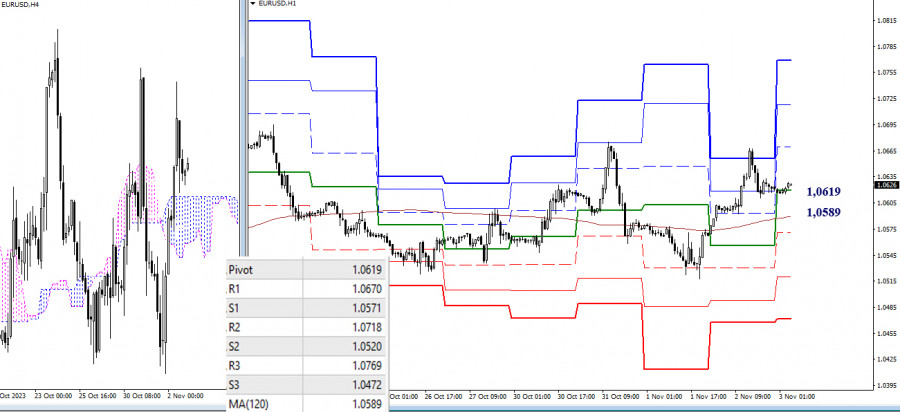
On the lower timeframes, despite the current decline, bulls continue to maintain an advantage. The resistances of the classic pivot points have expanded the potential for an upward move today, setting their targets at 1.0670 - 1.0718 - 1.0769. The loss of key levels at 1.0619 - 1.0589 (central pivot point + weekly long-term trend) may change the current balance of power in favor of strengthening bearish sentiments. In this case, attention will shift to the supports of the classic pivot points (1.0571 - 1.0520 - 1.0472).

***

GBP/USD

This image is no longer relevant

Higher timeframes

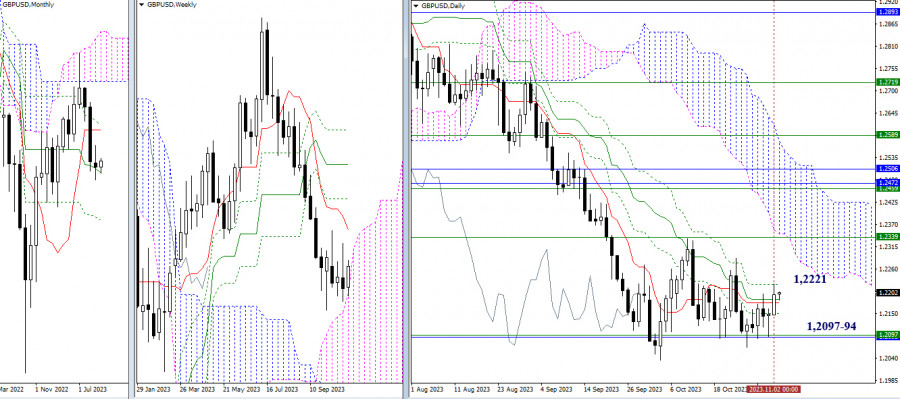
Yesterday, bulls continued to work with the resistances of the death cross of the daily Ichimoku cloud, the final level of which is 1.2221. The elimination of the daily cross will allow for consideration of new targets, such as the resistances of the weekly short-term trend (1.2339) and the lower boundary of the daily cloud (1.2347). The failure of the bulls and a return to the opponent's market will bring the relevance of passing the supports that continue to limit the current consolidation, located at 1.2094 - 1.2097 (upper boundary of the weekly cloud + monthly medium-term trend) and 1.2036 (low).

This image is no longer relevant

H4 - H1

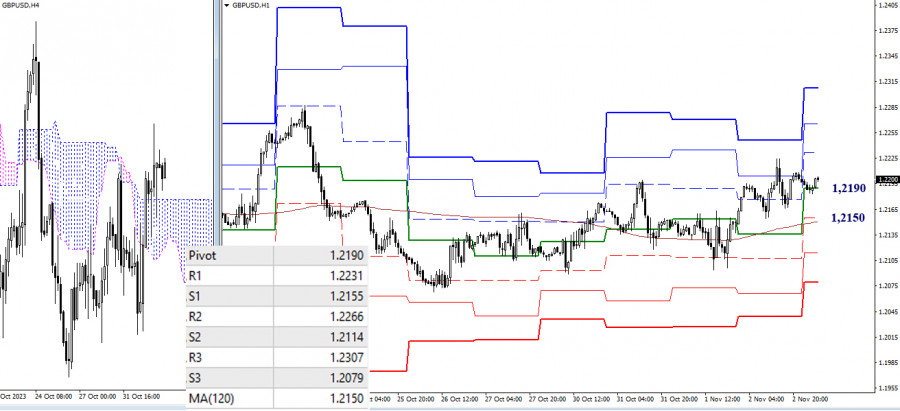
The main advantage, at the moment, continues to be on the bulls' side, as the pair on lower timeframes is still above the weekly long-term trend, which is currently located at the level of 1.2150. The reference points for the development of intraday movement are the classic pivot points. So, for bulls, the resistances of the classic pivot points (1.2231 - 1.2266 - 1.2307) may be of interest today, and for bears, the supports of the classic pivot points (1.2114 - 1.2079) may be significant.

***

The technical analysis of the situation uses:

Higher timeframes - Ichimoku Kinko Hyo (9.26.52) + Fibo Kijun levels

Lower timeframes - H1 - Pivot Points (classic) + Moving Average 120 (weekly long-term trend)

เลือกช่วงเวลา
5
นาที
15
นาที
30
นาที
1
ชั่วโมง
4
ชั่วโมง
1
วัน
1
สัปดาห์
รับผลกำไรจากการเปลี่ยนแปลงอัตราสกุลเงินดิจิทัลกับ InstaForex.
ดาวน์โหลด MetaTrader 4 และเปิดการซื้อขายครั้งแรกของคุณ.
ข่าวสารตลาดสหรัฐประจำวันที่ 9 เมษายน ดัชนีหุ้นสหรัฐฯ ปิดตลาดต่ำลงหลังจากทำเนียบขาวประกาศระลอกใหม่ของการเก็บภาษีสินค้าจากจีน อัตราภาษีอาจเพิ่มขึ้นถึง 104% ซึ่งส่งผลกระทบโดยตรงต่อการนำเข้าและเป็นสัญญาณชัดเจนว่าความตึงเครียดทางการค้าจะยังคงบานปลายต่อไป นักลงทุนมองว่าการเคลื่อนไหวนี้เป็นสัญญาณลบต่อเศรษฐกิจโลก การขายหุ้นกระทบกับหลายภาคส่วน โดยเฉพาะอย่างยิ่งภาคส่วนที่มีความอ่อนไหวต่อห่วงโซ่อุปทานทั่วโลก ตลาดตอบสนองอย่างรุนแรง แต่ความเคลื่อนไหวเหล่านี้สร้างโอกาสให้กับนักเทรด การซื้อขายระยะสั้นที่ใช้ความผันผวน การกระเด้งจากระดับหลัก และการซื้อตอนราคาตกร่วงล้วนเป็นกลยุทธ์ที่ใช้ได้ในสภาวะปัจจุบันนี้ เรามีเงื่อนไขที่ดีสำหรับการเทรดหุ้นสหรัฐฯ: ค่าคอมมิชชั่นต่ำและส่วนต่างราคาแคบทำให้สามารถเทรดได้อย่างมีประสิทธิภาพแม้ในช่วงที่ตลาดมีความผันผวนสูง
  • Grand Choice
    Contest by
    InstaForex
    InstaForex always strives to help you
    fulfill your biggest dreams.
    เข้าร่วมการแข่งขัน


บทความแนะนำ

EUR/USD และ GBP/USD – การวิเคราะห์ทางเทคนิคสำหรับวันที่ 9 เมษายน

ฝ่ายขาขึ้นกำลังพยายามที่จะกลับมาควบคุมอีกครั้ง และขณะนี้เรากำลังสังเกตกิจกรรมที่เพิ่มขึ้นและการผลักดันไปสู่จุดสูงสุดของการปรับฐานที่ 1.1147 การฝ่าฝืนระดับนี้สำเร็จ จะทำให้ตลาดเปลี่ยนความสนใจไประดับแนวต้านประวัติศาสตร์ที่ 1.1214 และ 1.1276 อย่างไรก็ตาม หากผู้ซื้อไม่สามารถฝ่าฝืนแนวต้านได้ คู่สกุลเงินอาจจะเผชิญกับแรงดึงดูดกลับไปยังระดับแนวรับจากช่วงเวลาต่างๆ ที่ต่ำกว่าอยู่ที่ 1.0984 – 1.0943

Evangelos Poulakis 10:07 2025-04-09 UTC+2

การวิเคราะห์ทางเทคนิคของการเคลื่อนไหว ราคาในวันของทรัพย์สินสินค้าโภคภัณฑ์ก๊าซธรรมชาติ วันพุธที่ 9 เมษายน 2025

บนกราฟ 4 ชั่วโมงของเครื่องมือสินค้าโภคภัณฑ์ Natual Gas ปรากฏรูปแบบ Bearish 123 ตามด้วย Bearish Ross Hook (RH) ตามมาด้วยการเคลื่อนไหวของราคาของ Natural

Arief Makmur 07:11 2025-04-09 UTC+2

การวิเคราะห์ทางเทคนิคเกี่ยวกับการเคลื่อนไหวของราคาภายในวันของคู่สกุลเงินสินค้าโภคภัณฑ์ USD/CAD วันพุธที่ 9 เมษายน 2025

แม้ว่าในกราฟ 4 ชั่วโมง สกุลเงินคู่ USD/CAD จะเคลื่อนที่ในช่อง Bearish แต่ด้วยการก่อตัวของรูปแบบ Bullish 123 และการอยู่เหนือ SMA 20 (Middle Line

Arief Makmur 07:11 2025-04-09 UTC+2

การคาดการณ์ค่าเงิน EUR/USD สำหรับวันที่ 9 เมษายน 2025

เมื่อสิ้นสุดวันอังคาร ยูโรเพิ่มขึ้น 45 จุด และในระหว่างเซสชันแปซิฟิกวันนี้ ยูโรได้เพิ่มขึ้นประมาณเท่ากัน ใกล้เข้ามาถึงระดับเป้าหมายที่ 1.1027 หากมีการทะลุแนวต้านออกไป ราคาอาจมุ่งไปที่ช่วง 1.1110/50 อย่างไรก็ตาม อาจมีการดักจับหมีอยู่ที่นั่น เหตุผลคือสินค้าโภคภัณฑ์และดัชนีหุ้นยังคงลดลงอย่างรวดเร็ว และอาจทำให้ยูโรไม่สามารถต้านทานแรงกดดันได้

Laurie Bailey 04:31 2025-04-09 UTC+2

การคาดการณ์ GBP/USD สำหรับวันที่ 9 เมษายน 2025

เมื่อวันอังคารที่ผ่านมา เงินปอนด์ของอังกฤษได้ทดสอบขอบเขตล่างของช่วงเป้าหมายที่ 1.2816/47 โดยมีเงาบน เช้านี้ราคาได้เคลื่อนเข้าสู่ช่วงนี้แล้ว การยืนหยัดเหนือช่วงนี้จะเปิดทางไปสู่เป้าหมายที่ 1.3001 เครื่องมือ Marlin oscillator กำลังแสดงความมองโลกในแง่ดี โดยพุ่งขึ้นอย่างรวดเร็วไปยังขอบเขตของพื้นที่การเติบโต ในกราฟ H4 Marlin

Laurie Bailey 04:31 2025-04-09 UTC+2

การคาดการณ์ AUD/USD สำหรับวันที่ 9 เมษายน 2025

ความพยายามของดอลลาร์ออสเตรเลียในการปรับตัวขึ้นเมื่อวันจันทร์และอังคารไปยังระดับเป้าหมายที่ 0.6133 ถูกหยุดลง (ดังที่เห็นจากเงาด้านบนที่ยาว) แต่ในวันนี้คู่สกุลเงินยังคงมุ่งหน้าไปสู่เป้าหมายดังกล่าวต่อไป ระดับ 0.5943 ยังทำหน้าที่เป็นแนวรับที่แข็งแกร่ง และออสซิลเลเตอร์ Marlin ได้เข้าสู่ระยะการปรับตัว เราคาดว่าจะมีความพยายามที่ประสบความสำเร็จในการถึงระดับ 0.6133 ราคาและออสซิลเลเตอร์ได้สร้างการแตกต่างแบบขาขึ้นในกราฟสี่ชั่วโมง เมื่อราคาขยับเข้าใกล้ระดับ

Laurie Bailey 04:31 2025-04-09 UTC+2

สัญญาณการซื้อขายสำหรับทองคำ (XAU/USD) สำหรับวันที่ 8-10 เมษายน 2025: เข้าซื้อที่ราคาสูงกว่า $2,993 (200 EMA - การดีดตัว)

ในช่วงเช้าต้นของเซสชันอเมริกา XAU/USD กำลังซื้อขายอยู่ที่ประมาณ 3010.85 ต่ำกว่าช่องแนวโน้มขาลงที่เริ่มก่อตัวขึ้นตั้งแต่ต้นเดือนเมษายน และกระเด้งขึ้นจากระดับต่ำที่ 2,948 ราคาทองคำกำลังซื้อขายเหนือ 200 EMA และเหนือ 6/8 Murray ซึ่งหมายความว่าโลหะชนิดนี้อาจยังคงปรับตัวขึ้นต่อไปในวันข้างหน้า โดยอาจจะไปถึง

Dimitrios Zappas 14:56 2025-04-08 UTC+2

สัญญาณการซื้อขายสำหรับ EUR/USD วันที่ 8-10 เมษายน 2025: ขายต่ำกว่า 1.0986 (200 EMA - 6/8 Murray)

ในช่วงต้นของการซื้อขายในสหรัฐฯ ยูโรซื้อขายอยู่ที่ประมาณ 1.0940 แสดงถึงการฟื้นตัวเล็กน้อยหลังจากแตะระดับต่ำสุดที่ 1.0900 EUR/USD มีแนวโน้มที่จะขึ้นต่อไปในไม่กี่ชั่วโมงข้างหน้าเพื่อไปยังแนวต้านที่ 6/8 มาร์รี่ที่ 1.0986 ยูโรกำลังพยายามสร้างความเข้มแข็งเหนือระดับจิตวิทยาที่ 1.1000 อย่างไรก็ตาม ในเชิงเทคนิคแล้ว ราคายังอยู่ในกรอบแนวโน้มขาลง

Dimitrios Zappas 14:54 2025-04-08 UTC+2

การคาดการณ์สำหรับ EUR/USD ในวันที่ 8 เมษายน 2025

ในวันจันทร์ ค่าเงินคู่ EUR/USD ได้ดีดตัวออกจากระดับการปรับฐาน 76.4% สองครั้ง ทำให้เป็นประโยชน์ต่อค่าเงินยูโร และยืนเหนือโซน 1.0944–1.0957 ได้สำเร็จ ผลจากการนี้อาจนำไปสู่การเคลื่อนไหวขึ้นไปสู่ระดับ Fibonacci ถัดไปที่ 127.2%

Samir Klishi 10:57 2025-04-08 UTC+2

การคาดการณ์สำหรับ GBP/USD ในวันที่ 8 เมษายน 2025

ในกราฟรายชั่วโมง คู่สกุลเงิน GBP/USD ยังคงลดลงในวันจันทร์และสิ้นสุดวันที่ใกล้ระดับ 1.2709 แค่เพียงสองวันของการซื้อขาย, เงินปอนด์ลดลงประมาณ 500 จุด การฟื้นตัวจากระดับ 1.2709 ช่วยให้เงินปอนด์ฟื้นตัวเข้าสู่โซนแนวต้านที่ 1.2788–1.2801 การฟื้นตัวจากโซนนี้จะเป็นประโยชน์ต่อดอลลาร์สหรัฐและบ่งชี้การเริ่มลดลงอีกครั้งไปยังระดับ 1.2709

Samir Klishi 10:53 2025-04-08 UTC+2
หากไม่สะดวกคุยในตอนนี้
ระบุคำถามไว้ได้ใน แชท.
Widget callback
 

Dear visitor,

Your IP address shows that you are currently located in the USA. If you are a resident of the United States, you are prohibited from using the services of InstaFintech Group including online trading, online transfers, deposit/withdrawal of funds, etc.

If you think you are seeing this message by mistake and your location is not the US, kindly proceed to the website. Otherwise, you must leave the website in order to comply with government restrictions.

Why does your IP address show your location as the USA?

  • - you are using a VPN provided by a hosting company based in the United States;
  • - your IP does not have proper WHOIS records;
  • - an error occurred in the WHOIS geolocation database.

Please confirm whether you are a US resident or not by clicking the relevant button below. If you choose the wrong option, being a US resident, you will not be able to open an account with InstaForex anyway.

We are sorry for any inconvenience caused by this message.