


сила сигнала 1 из 5
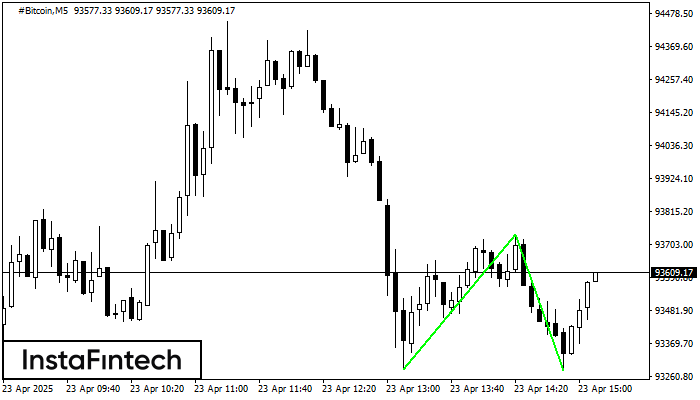
Сформирована фигура «Двойное дно» на графике #Bitcoin M5. Верхняя граница 93737.29; Нижняя граница 93280.25; Ширина фигуры 45284 пунктов. В случае пробоя верхней границы 93737.29 можно будет прогнозировать изменение тенденции, где ширина фигуры и будет являться расстоянием предположительного Тейк Профита.
Таймфреймы М5 и М15 могут иметь больше ложных точек входа.
Shuningdek ko'ring
- Все
- Вымпел
- Голова и плечи
- Двойная вершина
- Прямоугольник
- Треугольник
- Тройная вершина
- Флаг
- Все
- #AAPL
- #AMZN
- #Bitcoin
- #EBAY
- #FB
- #GOOG
- #INTC
- #KO
- #MA
- #MCD
- #MSFT
- #NTDOY
- #PEP
- #TSLA
- #TWTR
- AUDCAD
- AUDCHF
- AUDJPY
- AUDUSD
- EURCAD
- EURCHF
- EURGBP
- EURJPY
- EURNZD
- EURRUB
- EURUSD
- GBPAUD
- GBPCHF
- GBPJPY
- GBPUSD
- GOLD
- NZDCAD
- NZDCHF
- NZDJPY
- NZDUSD
- SILVER
- USDCAD
- USDCHF
- USDJPY
- USDRUB
- Все
- M5
- M15
- M30
- H1
- D1
- Все
- Покупка
- Продажа
- Все
- 1
- 2
- 3
- 4
- 5
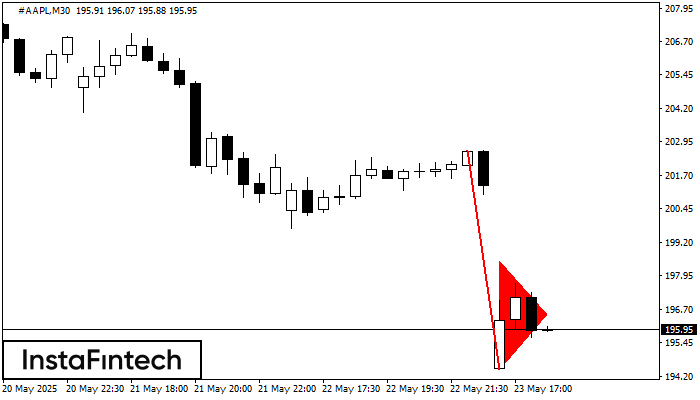
The Bearish pennant pattern has formed on the #AAPL M30 chart. The pattern signals continuation of the downtrend in case the pennant’s low of 194.47 is broken through. Recommendations: Place
Открыть график инструмента в новом окне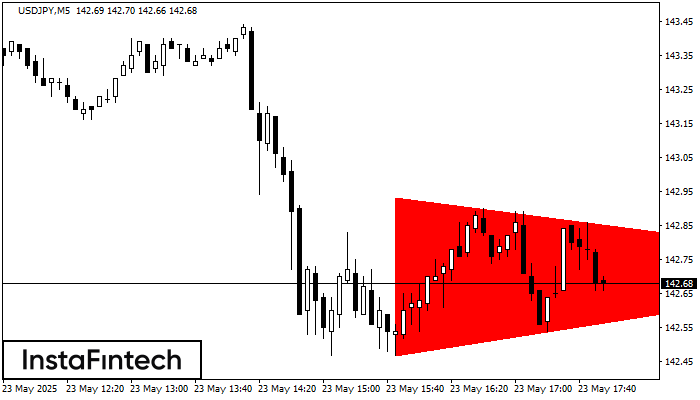
According to the chart of M5, USDJPY formed the Bearish Symmetrical Triangle pattern. Description: The lower border is 142.47/142.72 and upper border is 142.93/142.72. The pattern width is measured
The M5 and M15 time frames may have more false entry points.
Открыть график инструмента в новом окне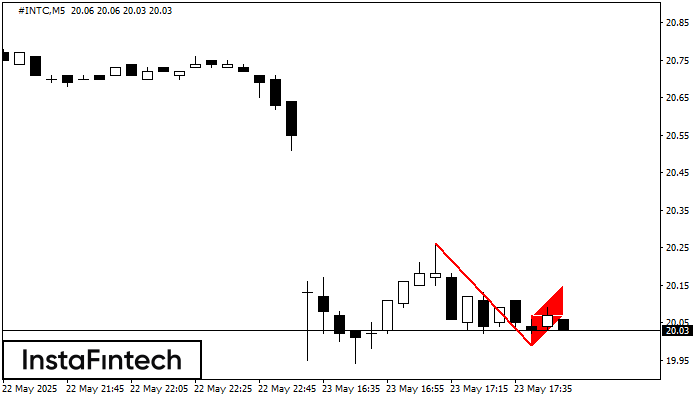
The Bearish Flag pattern has been formed on the chart #INTC M5 which signals that the downward trend will continue. If the price breaks below the low at 19.99, then
The M5 and M15 time frames may have more false entry points.
Открыть график инструмента в новом окне


